Report Generation
Discover how DataPallas lets you generate financial statements, payslips, invoices, or any report type with the help of AI. With DataPallas and AI, you describe your reporting needs in plain English and instantly get high-quality queries, scripts, and templates—no coding required. Build professional reports in any format, directly from your data.
Table of Contents
- Introduction to Configuring Reports
- Creating Reports
- Supported Data Sources
- Output Formats
- Report Templates Examples Gallery
- Generate Reports
- Advanced Options & Transformations (for datasources)
Introduction to Configuring Reports
This guide covers the mechanics of building a report in DataPallas — the Reporting configuration screen and what each of its tabs does. You configure a report in three main steps:
- DataSource — where your data comes from: a SQL query, a Groovy script, or a file such as CSV, XML, or Excel.
- Output / Template — what the finished report looks like (PDF, Excel, Word, HTML, or any text format) and the template that shapes it.
- Generate Reports — run the configuration to produce your documents.
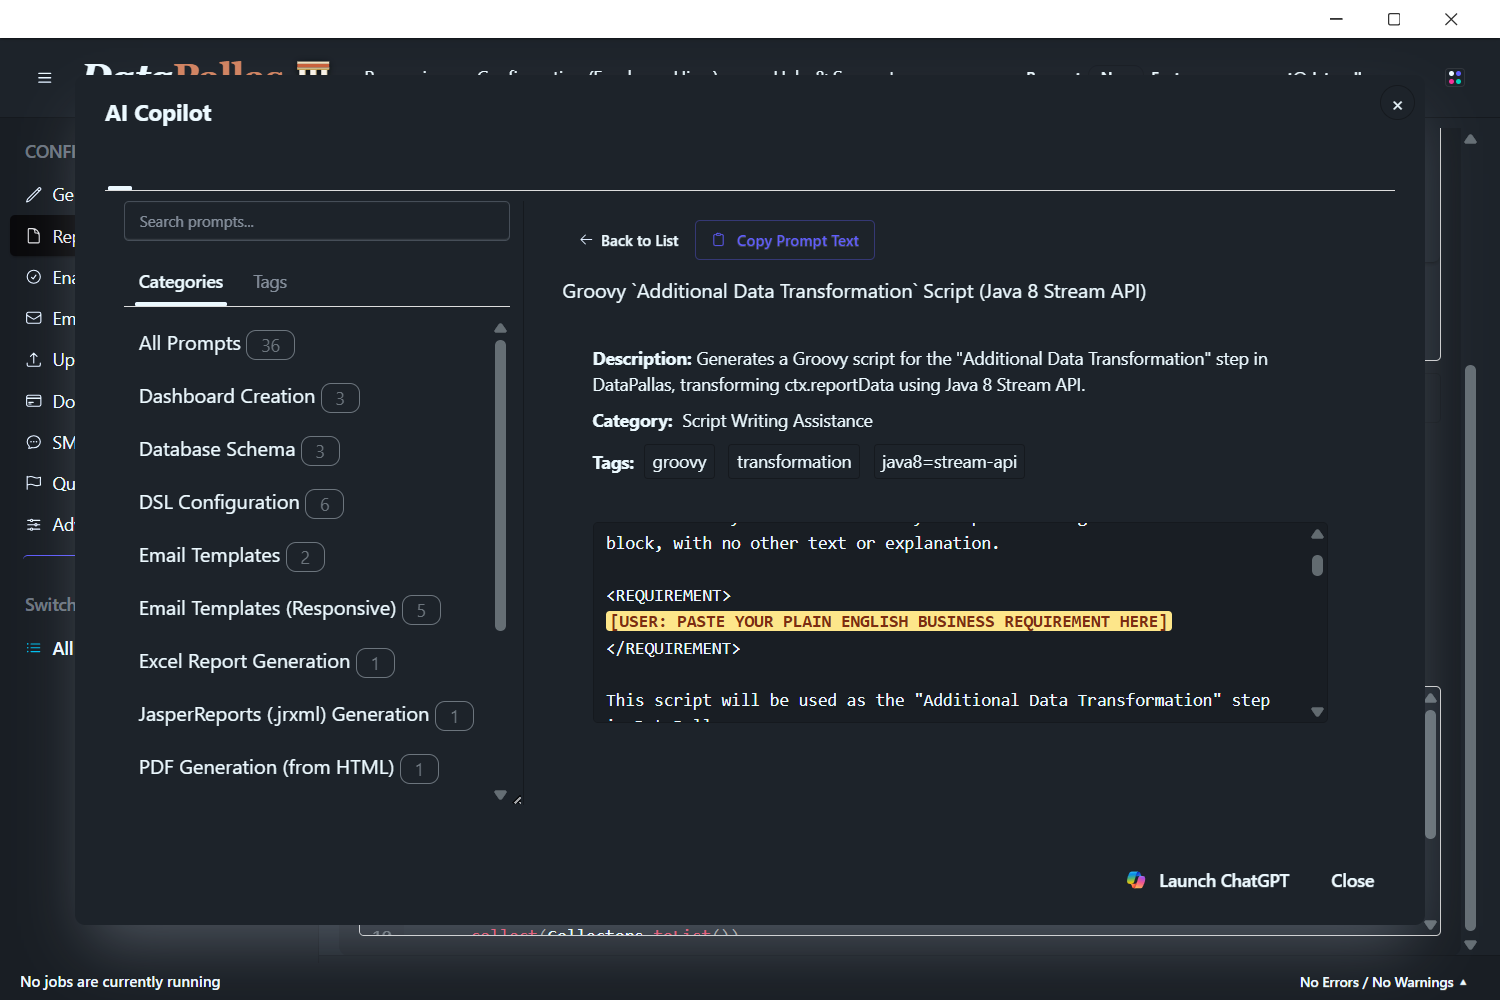
Wherever a step asks for code — SQL, a script, a template, report parameters, or a data transformation — a Hey AI, Help Me... button sits right next to it. You never have to write that code yourself: describe what you need in plain English and the AI writes it for you.
To watch AI build a simple report from start to finish, read:
Creating Reports
Before creating any report, you'll most likely need to configure and connect to your database connections first.
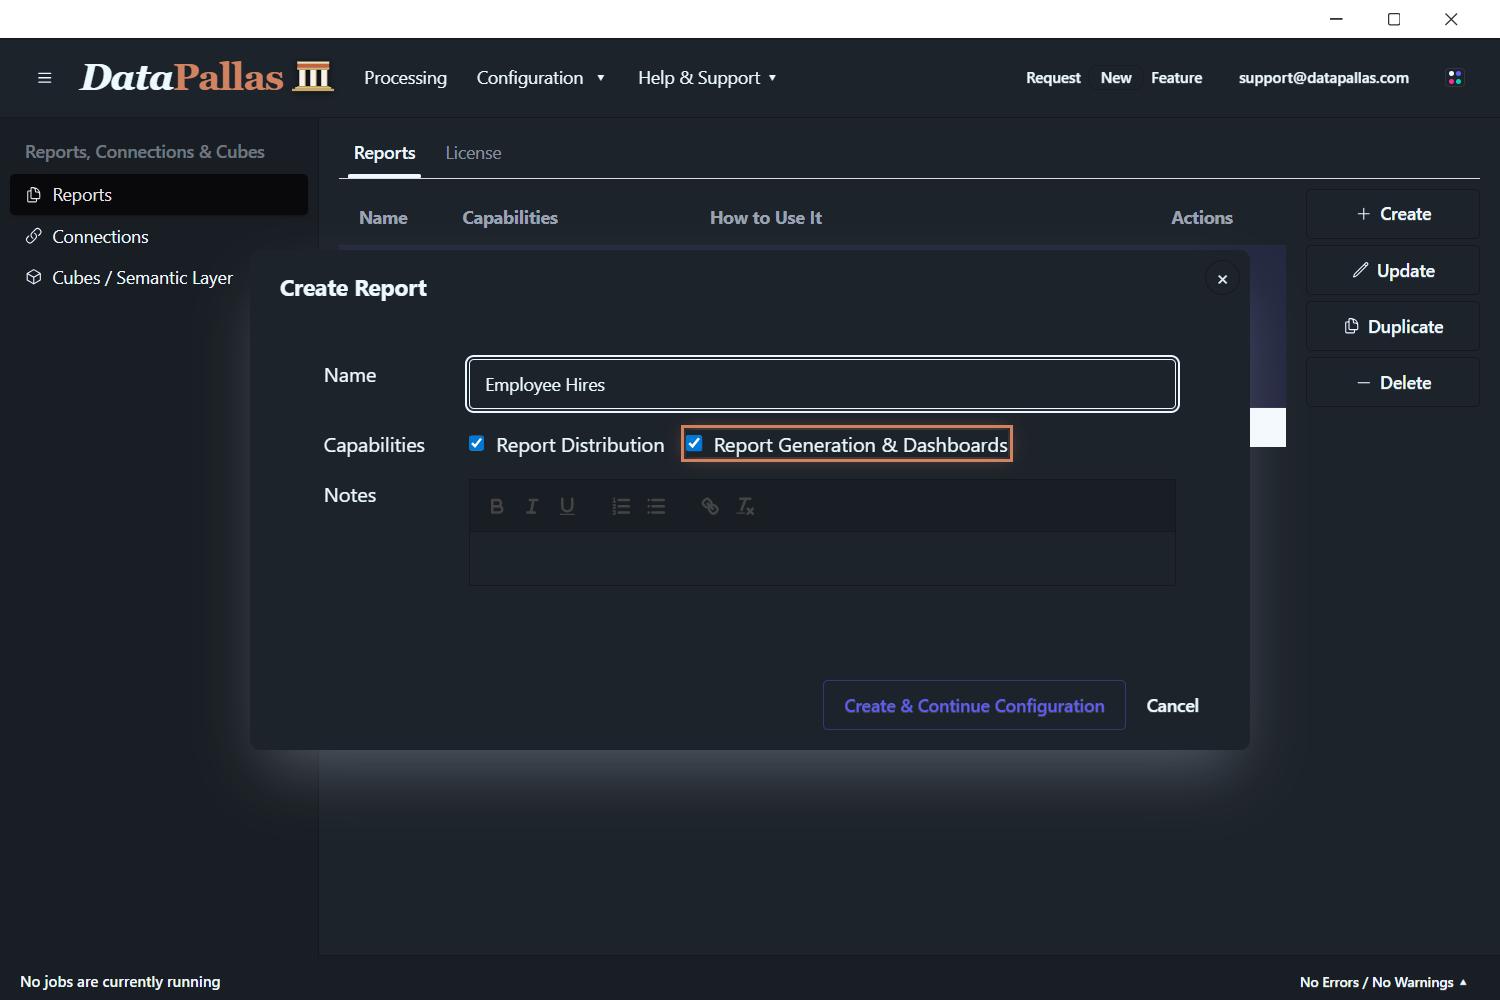
Once you have created and connected to your database connection, you can create a report — open Configuration → Reports in the main menu and select Report Generation.
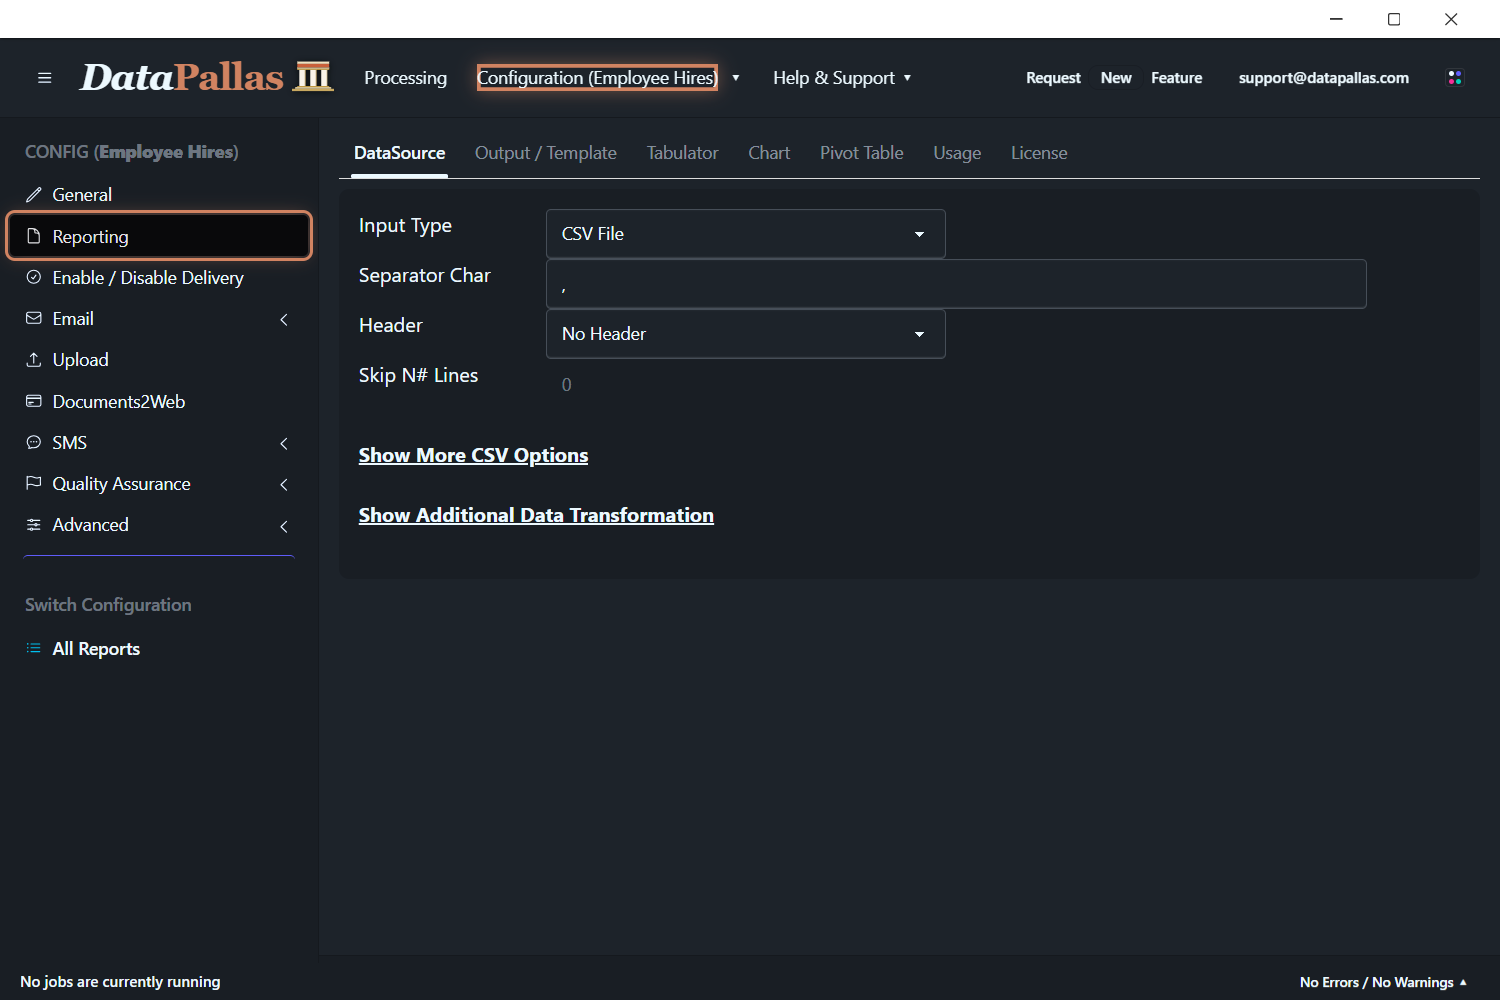
Choose Configuration (Your Newly Created Report) to set up your report.
Supported Data Sources
DataPallas supports a wide range of structured data sources, giving you flexibility in how you store and manage your data.
SQL Query Database
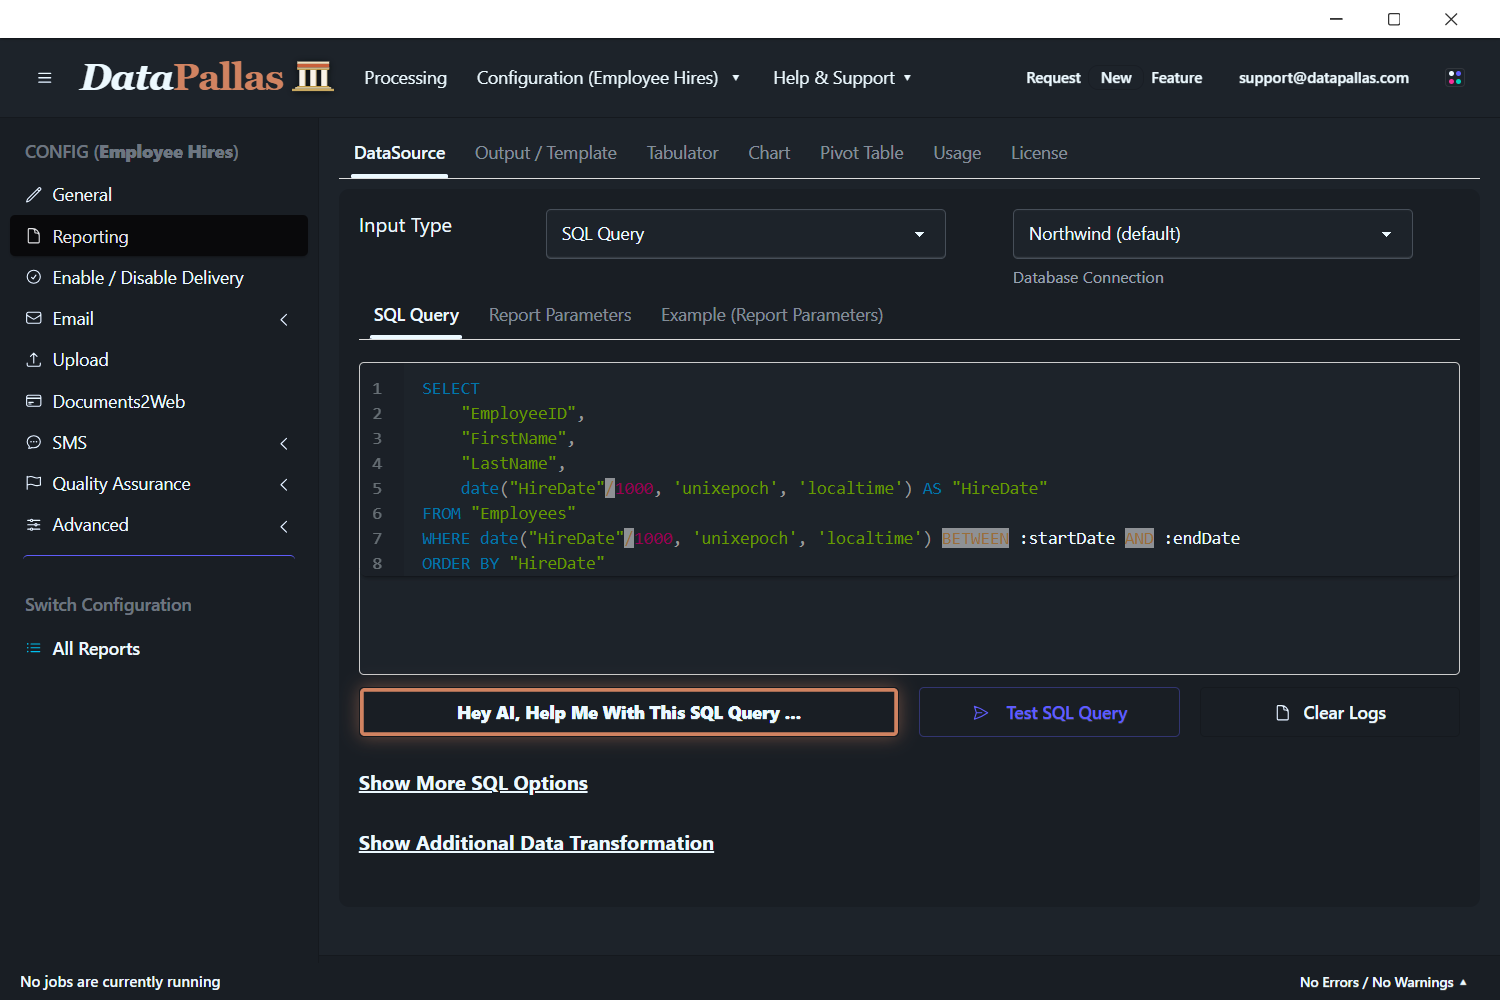
Create reports by running SQL queries on your database. Your query can be as simple or as complex as needed.
You can write the query yourself, or let AI generate it for you—just describe your requirements in plain English.
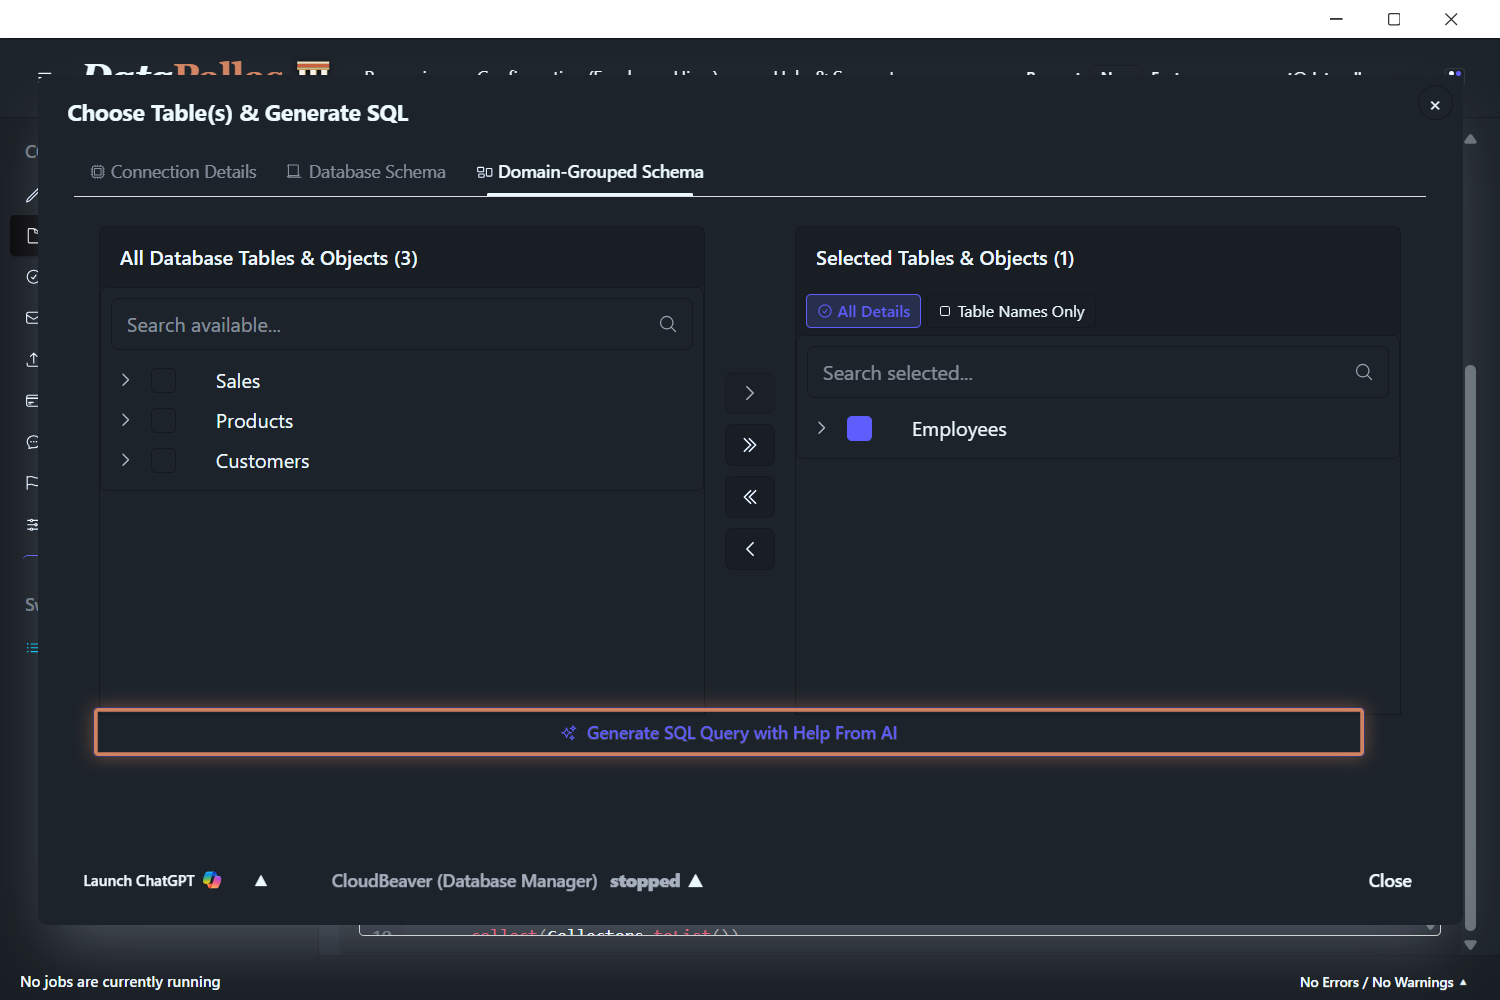
Script (for custom logic or any data source)
Some reports need more flexible data fetching than a single SQL query. Use a Groovy script when you need:
- Complex data preparation, aggregation, or transformation
- Master-detail, crosstab, chart, or scorecard reports
- Advanced business logic or calculations
- Data from multiple databases or sources
- Data from NoSQL or unstructured sources
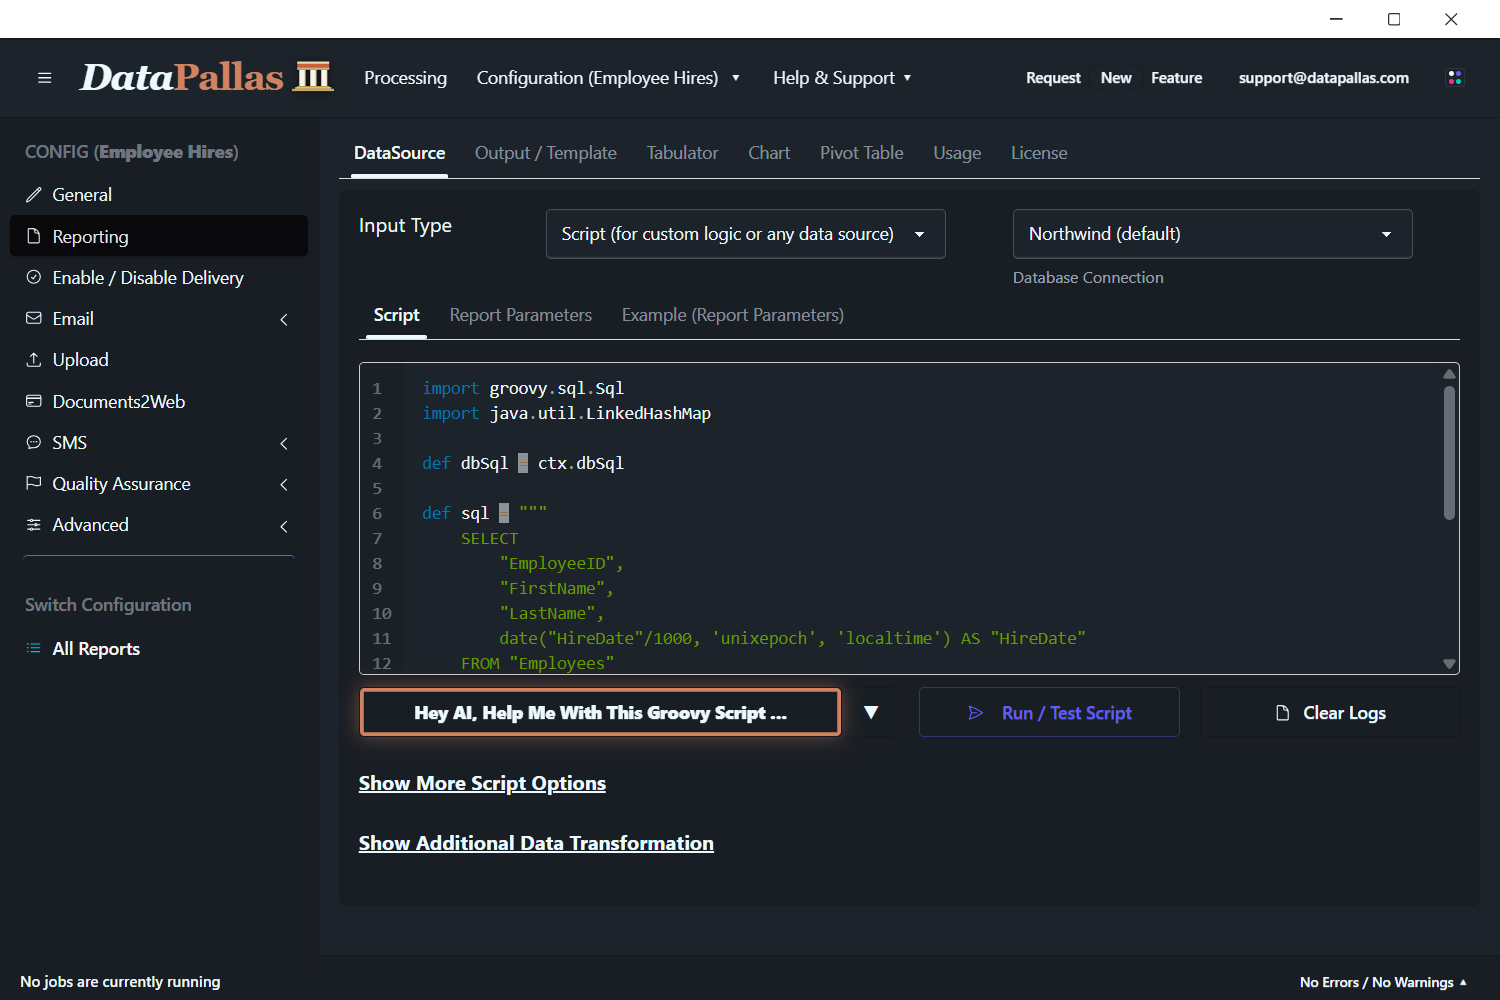
You can write the Groovy script yourself, or let AI help you generate both the script and any required SQL queries.
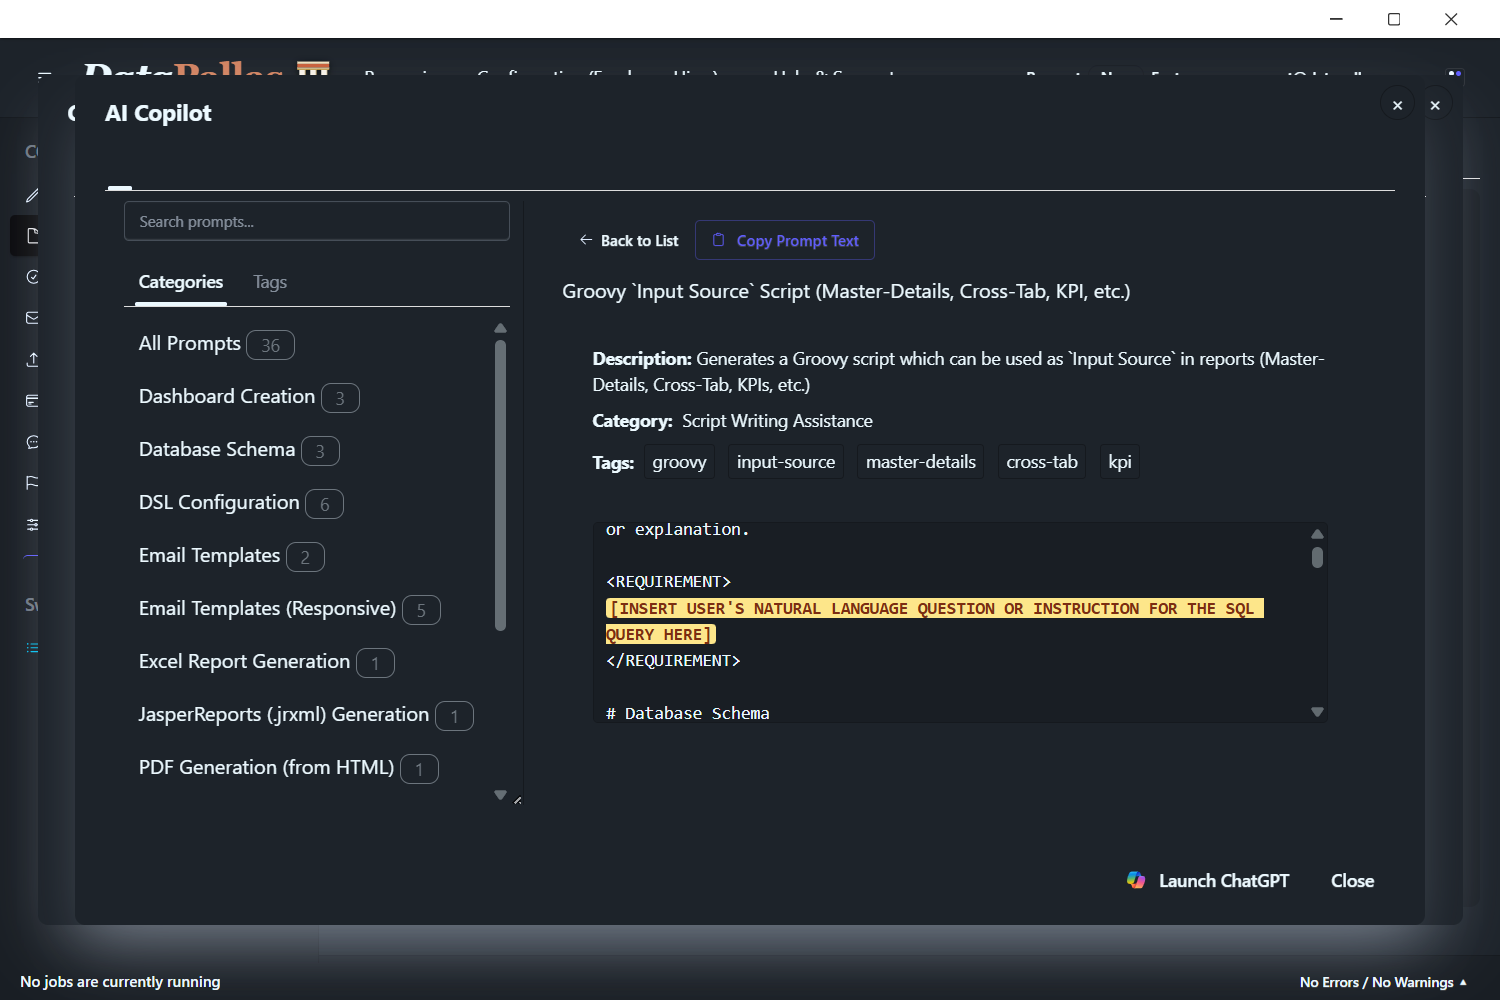
When customizing the AI prompt, just replace the highlighted placeholder with your own requirements. Use DataPallas’s AI helpers for both Groovy scripts and SQL queries.
Why Groovy?
Groovy is the most pragmatic choice for DataPallas’s tech stack. It lets you write concise code to get things done quickly. Debates about programming languages matter less in the age of AI—focus on results.
XML Files
XML files hold hierarchical, structured data and are common in system integrations and data exchanges.
- Options:
- Repeating Node XPath — identifies each record in the document
- ID column selection (via a custom XPath)
- Namespace mappings for namespaced documents
- Whitespace trimming
CSV Files
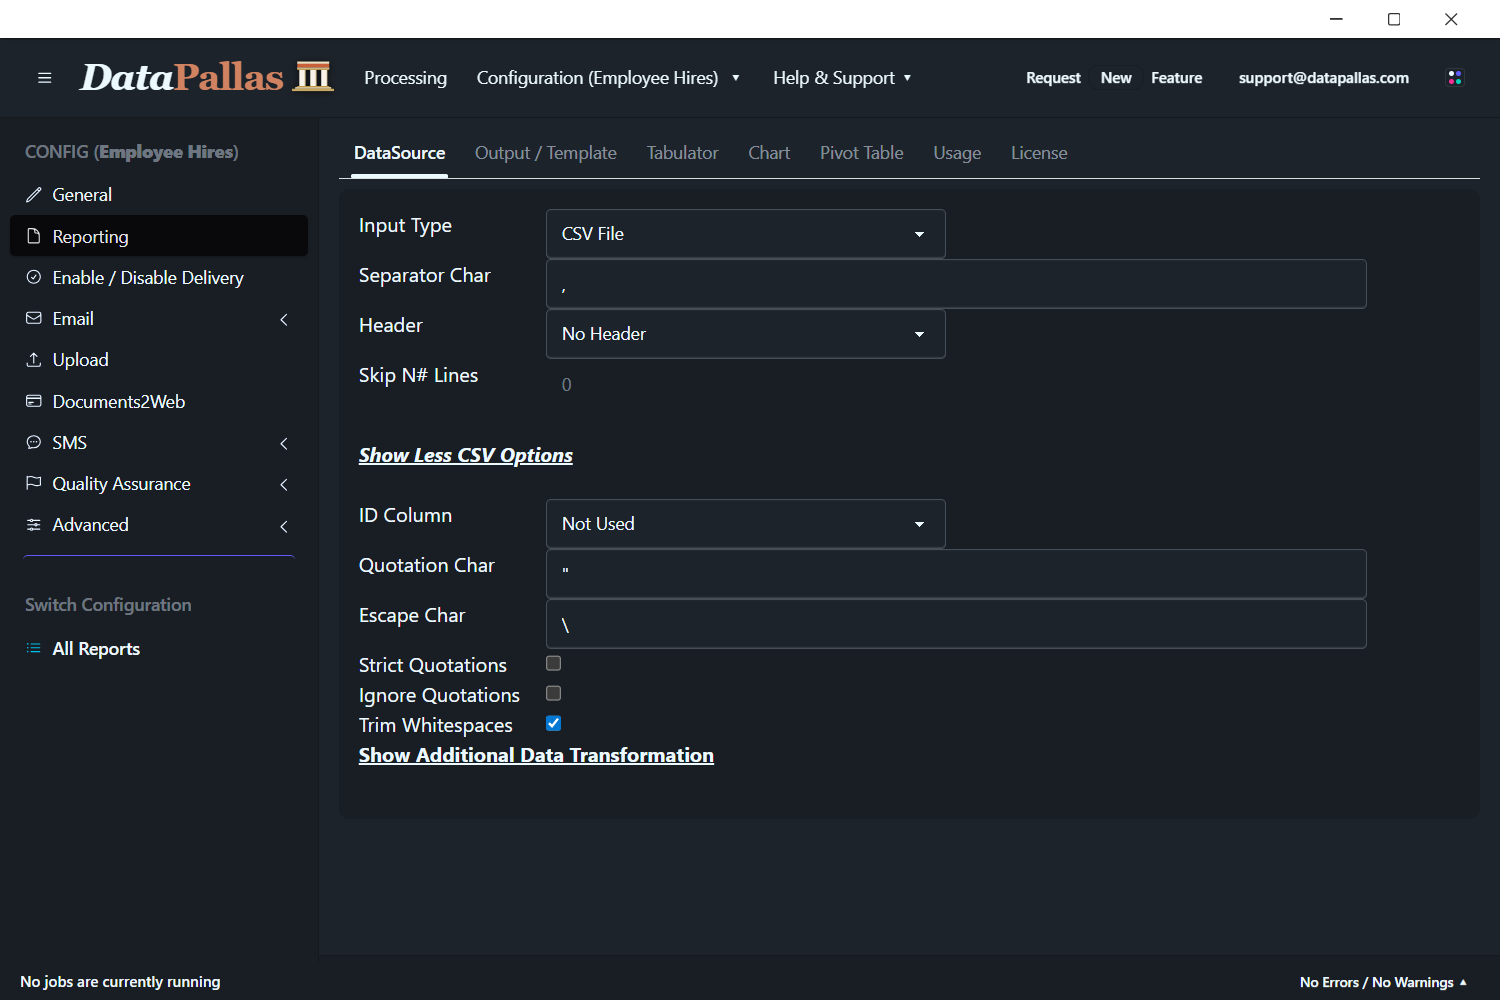
CSV files are a common way to store tabular data and are easy to create from many systems.
- Options:
- Separator character (default: comma)
- Header options (none, first line, or multiple lines)
- Skip lines for multi-line headers
- Advanced quotation and escape character settings
- ID column selection for mapping records
TSV Files
TSV files use tab characters as separators, which is helpful when your data contains commas.
- Options:
- Fixed tab separator
- Same header and advanced options as CSV
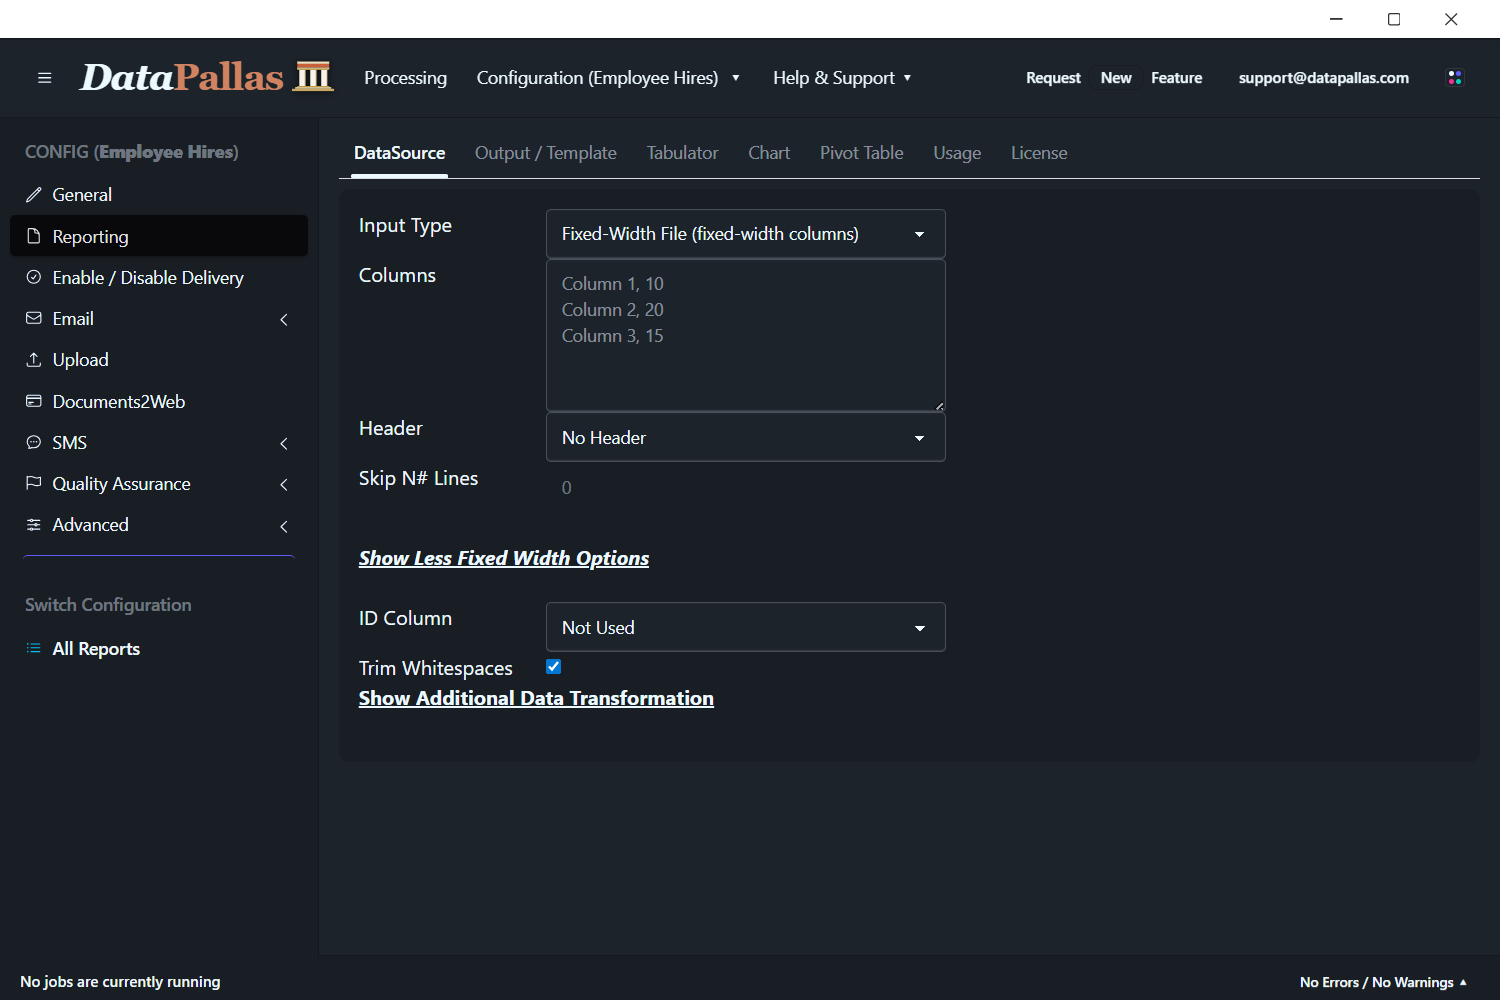
Fixed-Width Files
Fixed-width files store data in columns of set width, common in legacy systems and standardized exchanges.
- Options:
- Column definitions (name and width)
- Header options (none or first line)
- Skip lines
- ID column selection
Excel Files
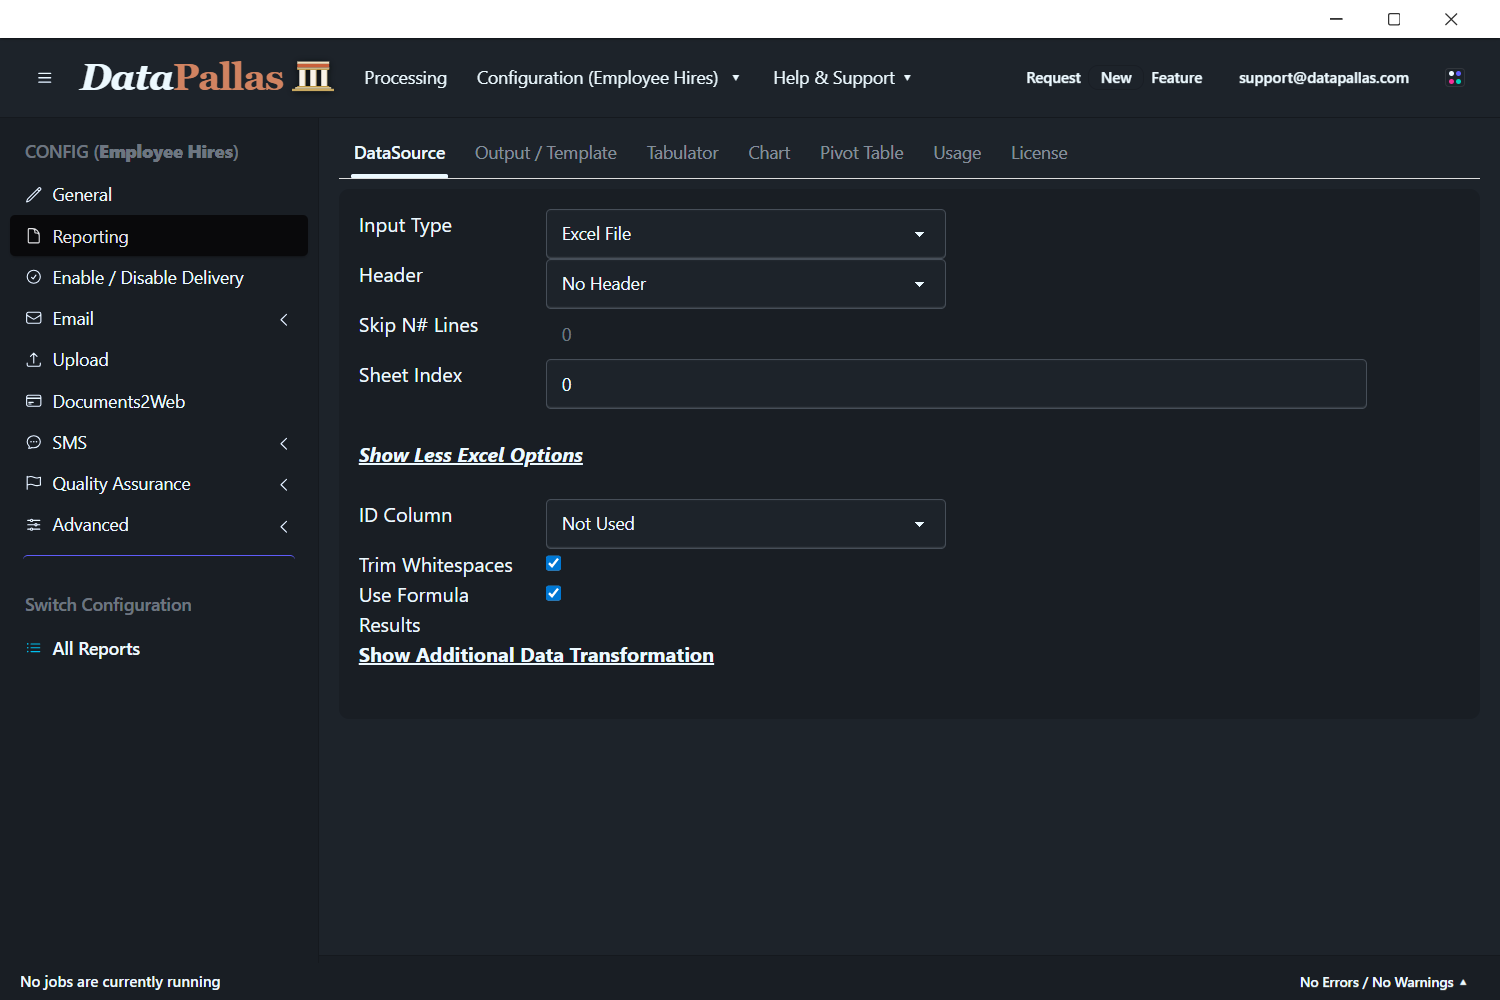
Excel files (XLS/XLSX) support multiple worksheets and formatted data.
- Options:
- Header options (none, first line, or multiple lines)
- Sheet index selection
- Skip lines
- Formula evaluation
- ID column selection
Google Sheets
(coming soon)
Microsoft Office 365 Excel Sheets
(coming soon)
Output Formats
DataPallas generates reports in multiple formats to meet your business needs and recipient preferences.
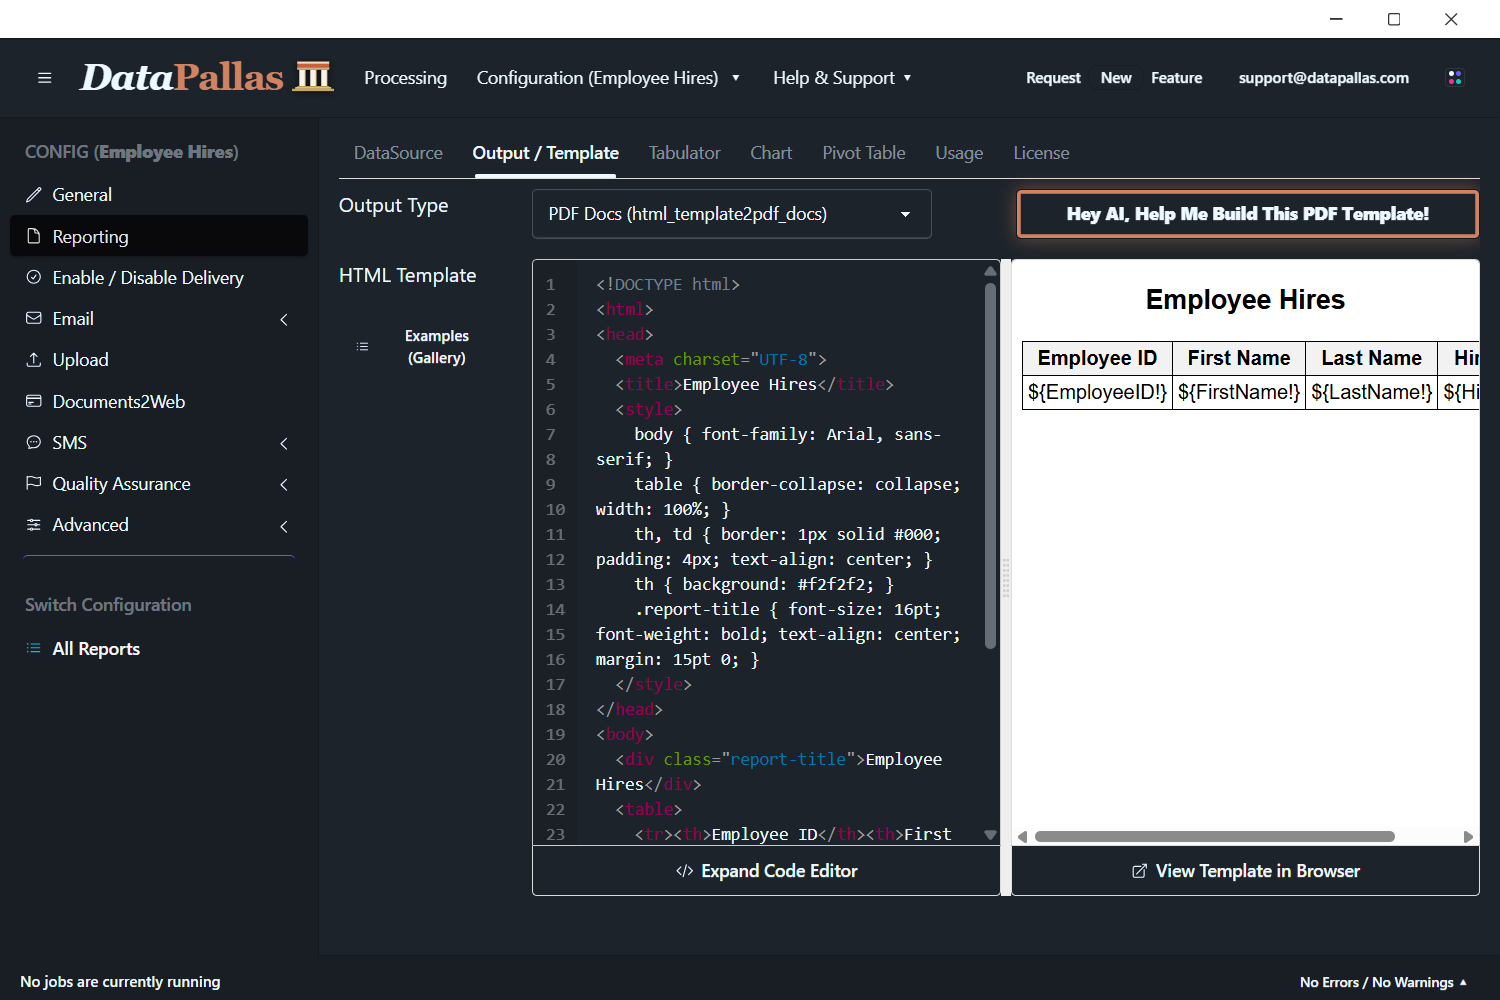
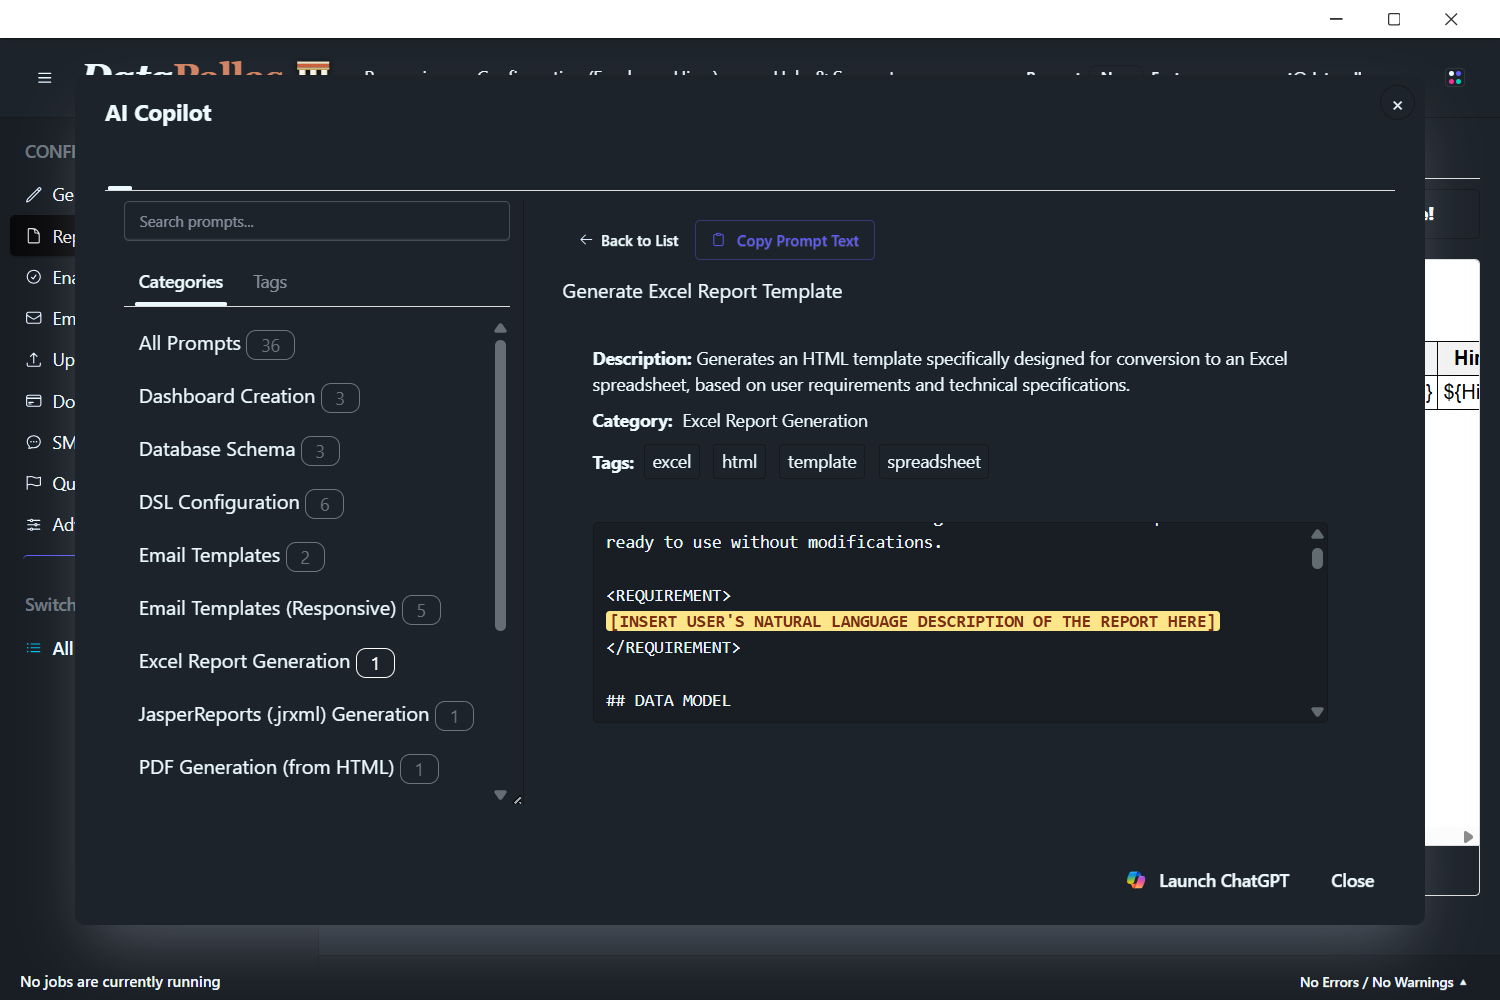
For most formats, use the 'Hey AI, Help Me Build This Template!' button to get started.
None
Choose 'None' when you only need to send emails without attachments, such as newsletters or announcements. For documents (PDF, Excel, etc.), select the appropriate output type.
PDF Documents
PDF is ideal for professional reports that need consistent formatting across devices.
- Features:
- Based on HTML templates converted to PDF (full power of HTML & CSS for design)
- Supports paged layouts with headers/footers
- Preserves formatting everywhere
- Perfect for invoices and statements
- 'Hot reload' preview for HTML templates
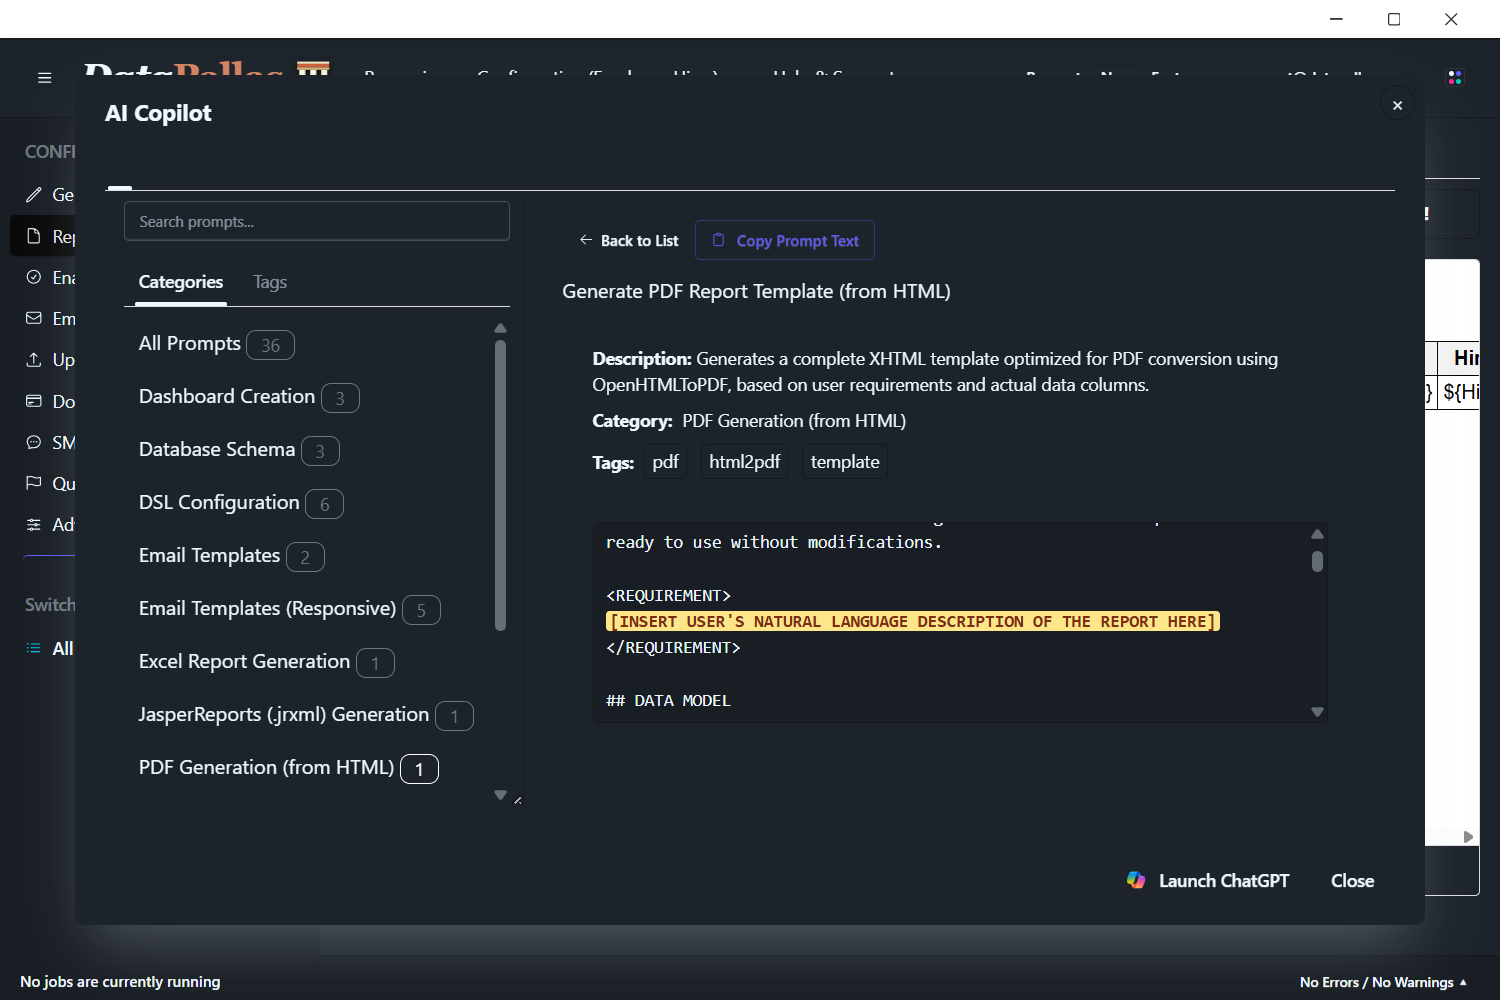
Browse DataPallas’s AI prompt snippets for building HTML/CSS templates for PDF documents.
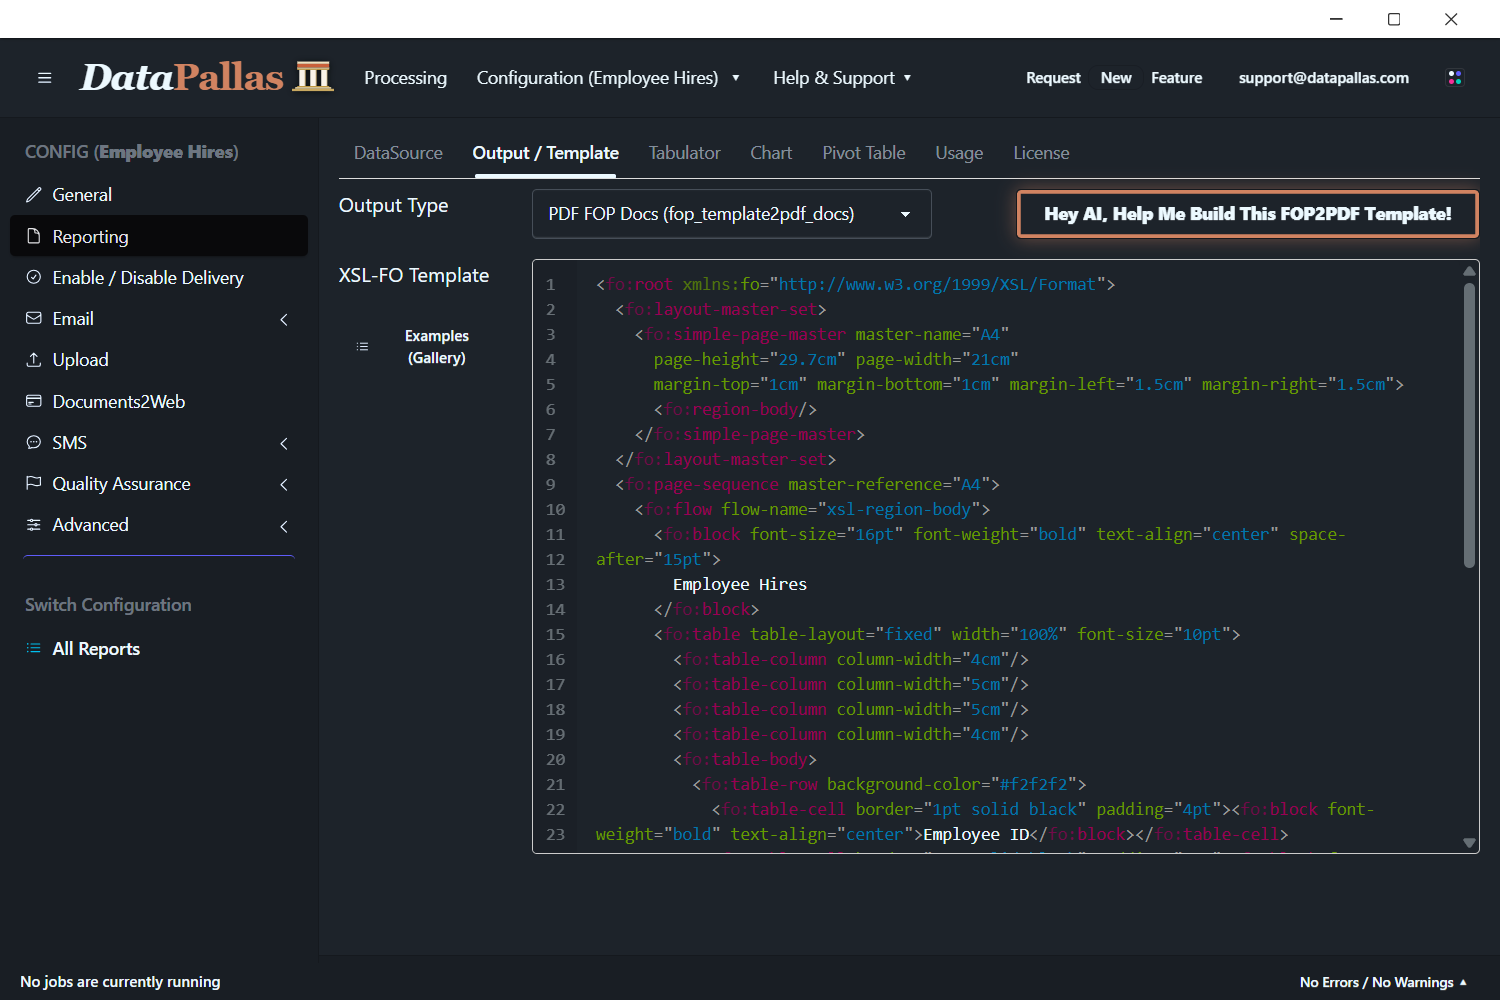
XSL-FO (Extensible Stylesheet Language – Formatting Objects)
DataPallas can also generate PDF files using XSL-FO, a markup language for high-quality paginated documents.
Excel Documents (xlsx)
Excel output is perfect for financial reports and data that recipients want to analyze or modify.
- Features:
- Generated from HTML templates with tables
- Includes formulas and calculations
- Recipients can edit and analyze data
- Great for financial summaries
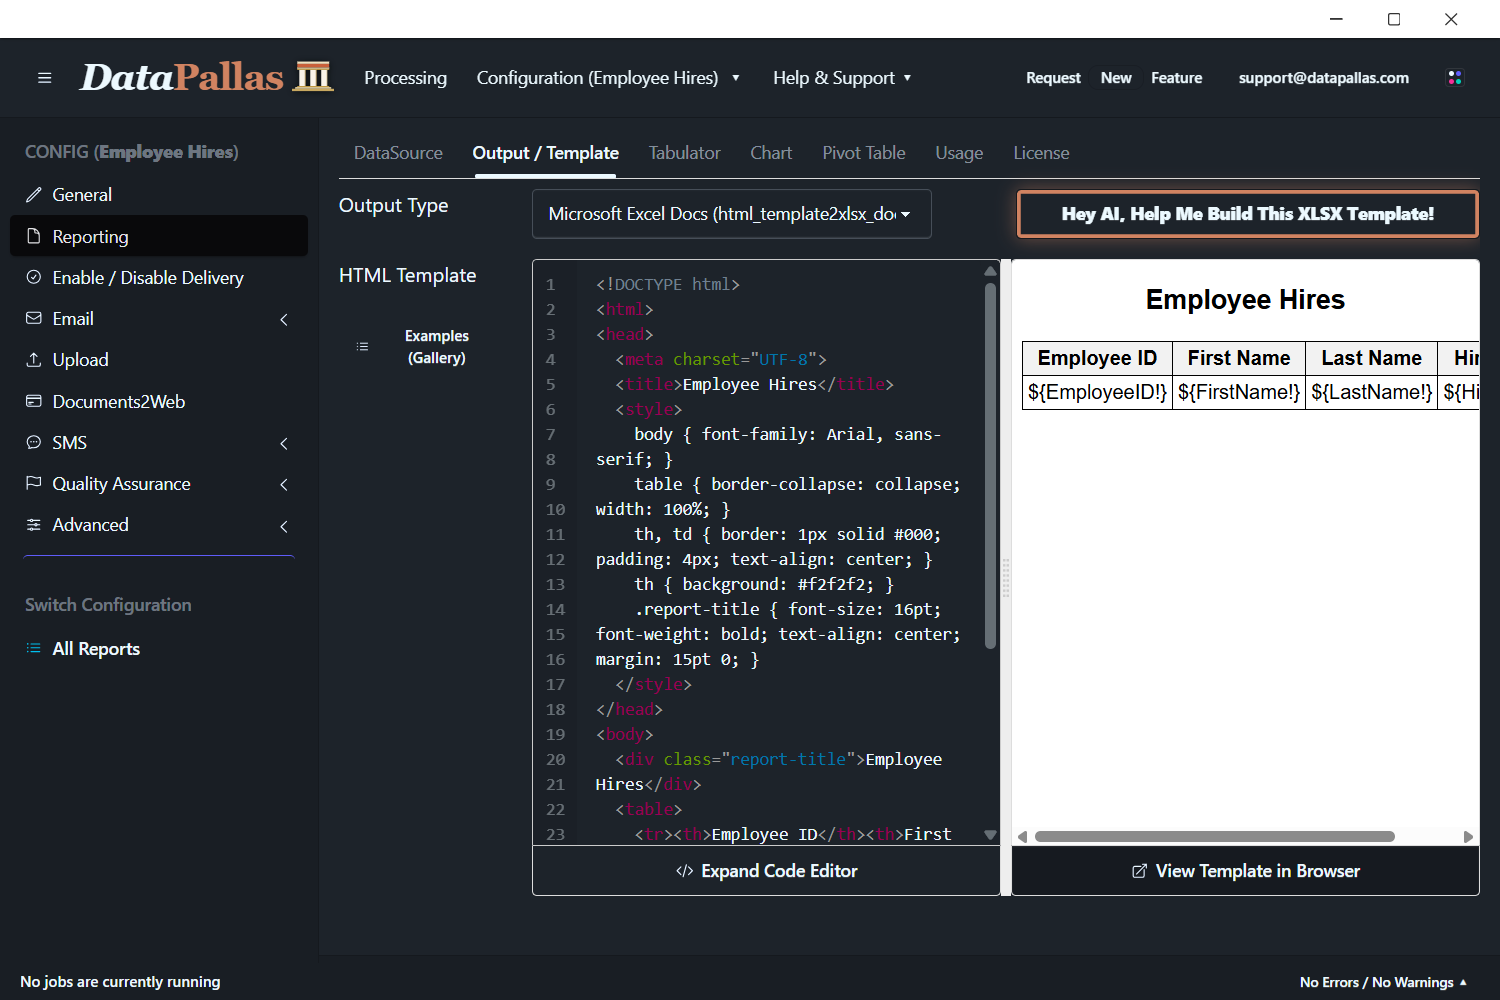
DataPallas uses HTML and CSS for Excel reports. Your template must follow specific rules, which are built into the Excel AI prompt. Customize only the marked sections for your report.
HTML Documents
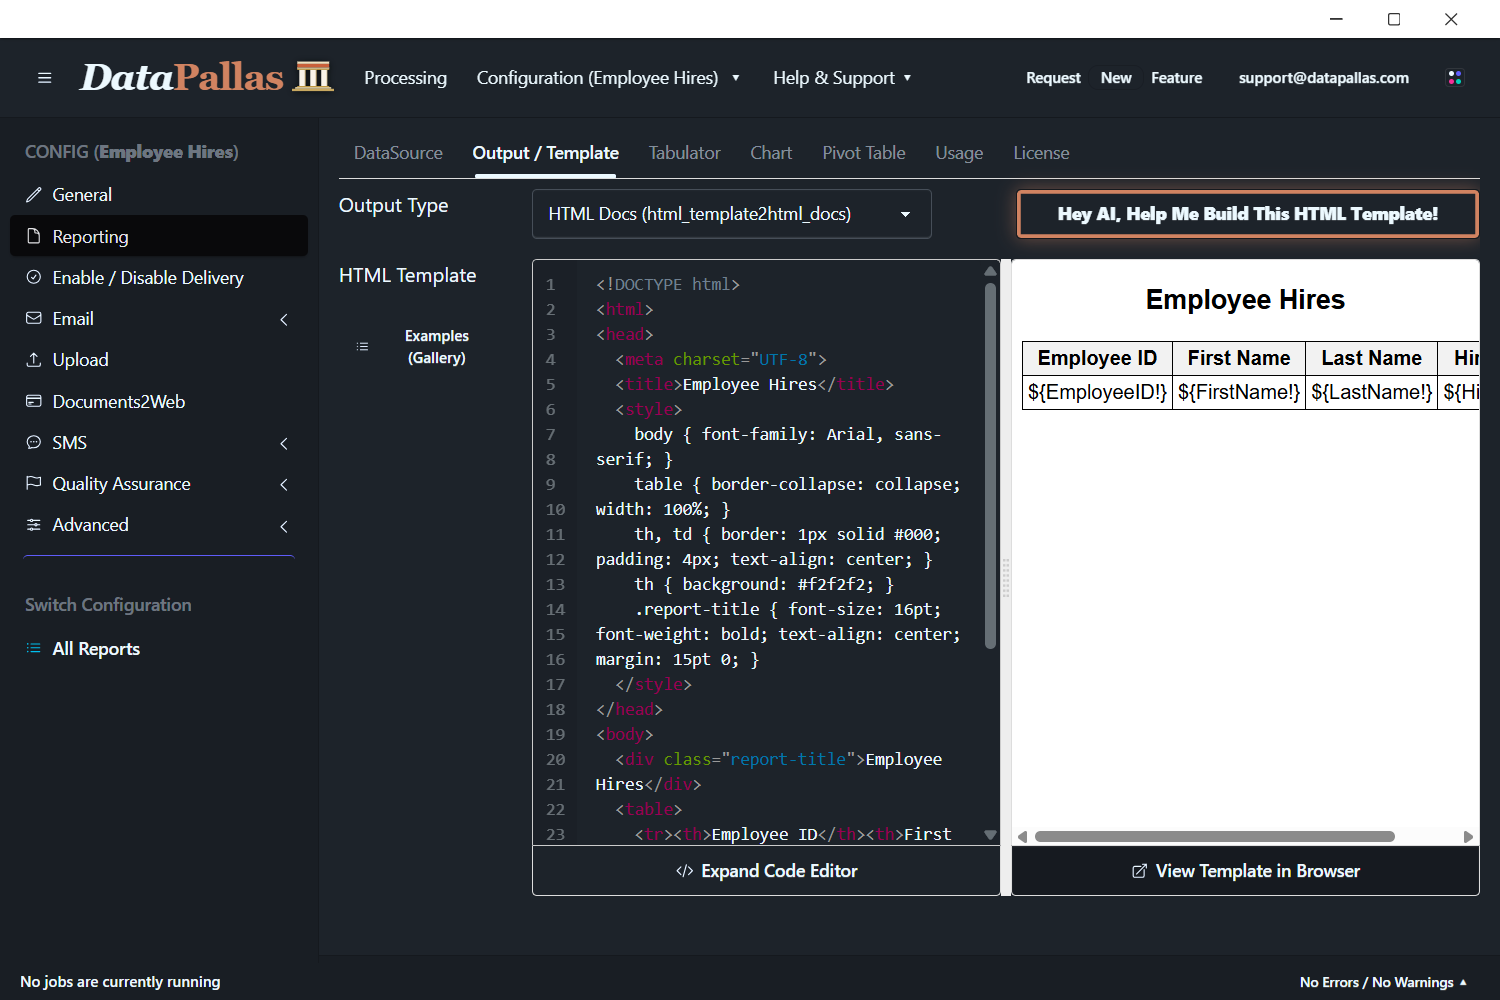
HTML output provides interactive, web-ready reports for browsers or websites.
- Features:
- Direct output of your HTML templates
- Interactive elements supported
- Easy web distribution
- Ideal for dashboards and online reporting
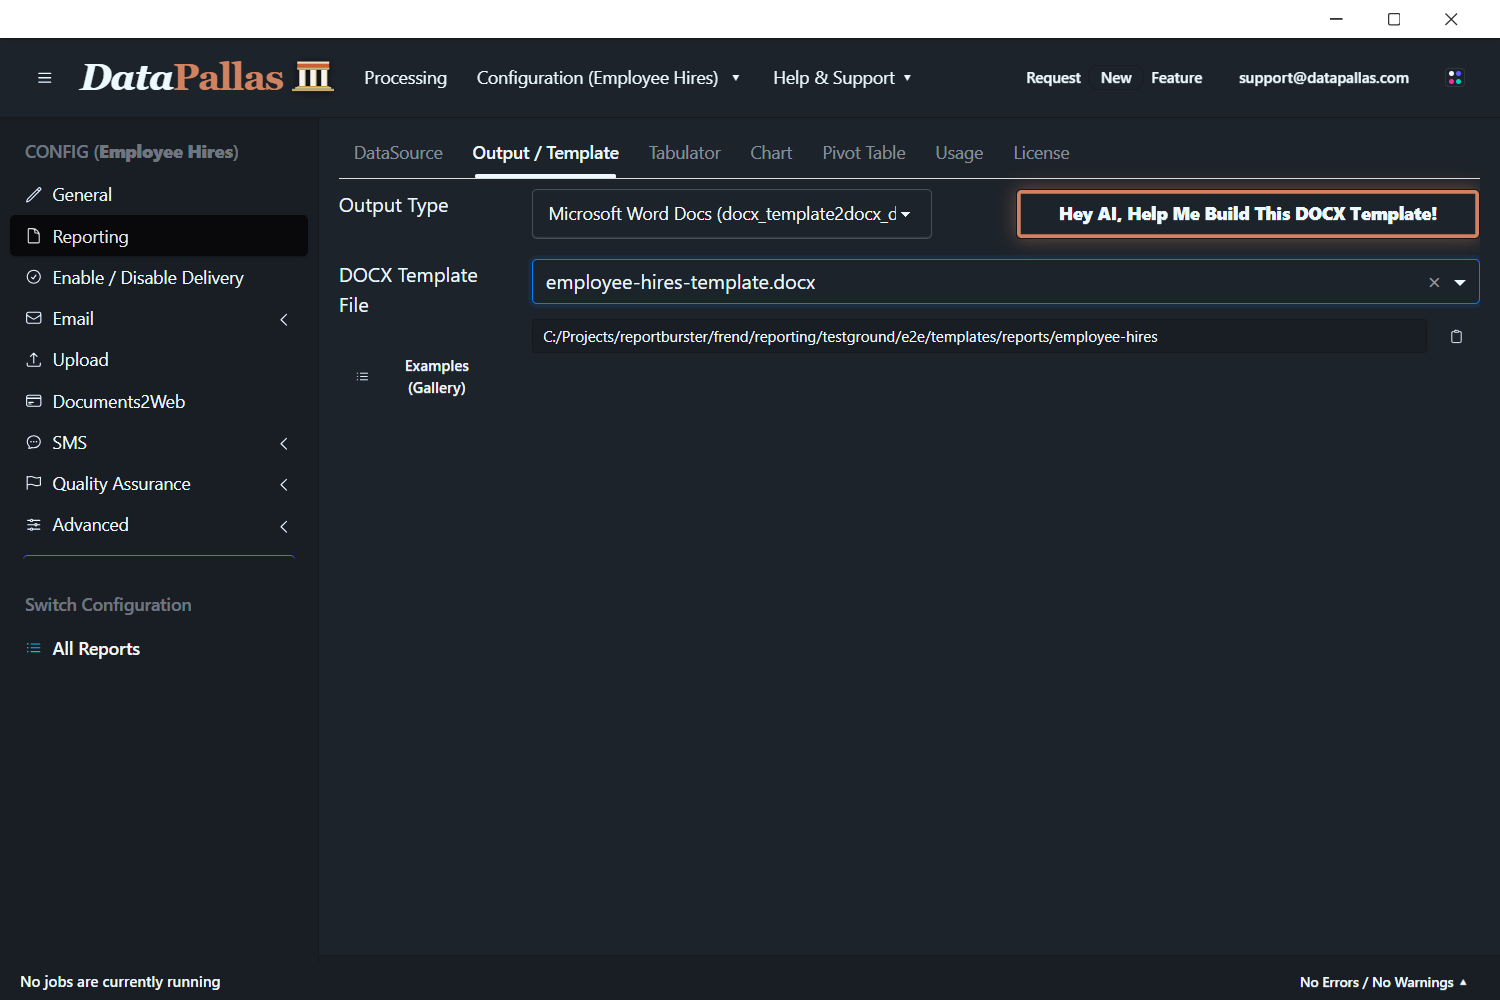
Word Documents (docx)
Word documents are ideal for text-heavy reports that may need further editing.
- Features:
- Based on DOCX templates with merge fields
- Professional formatting and branding
- Editable by recipients
- Perfect for contracts, letters, and personalized documents
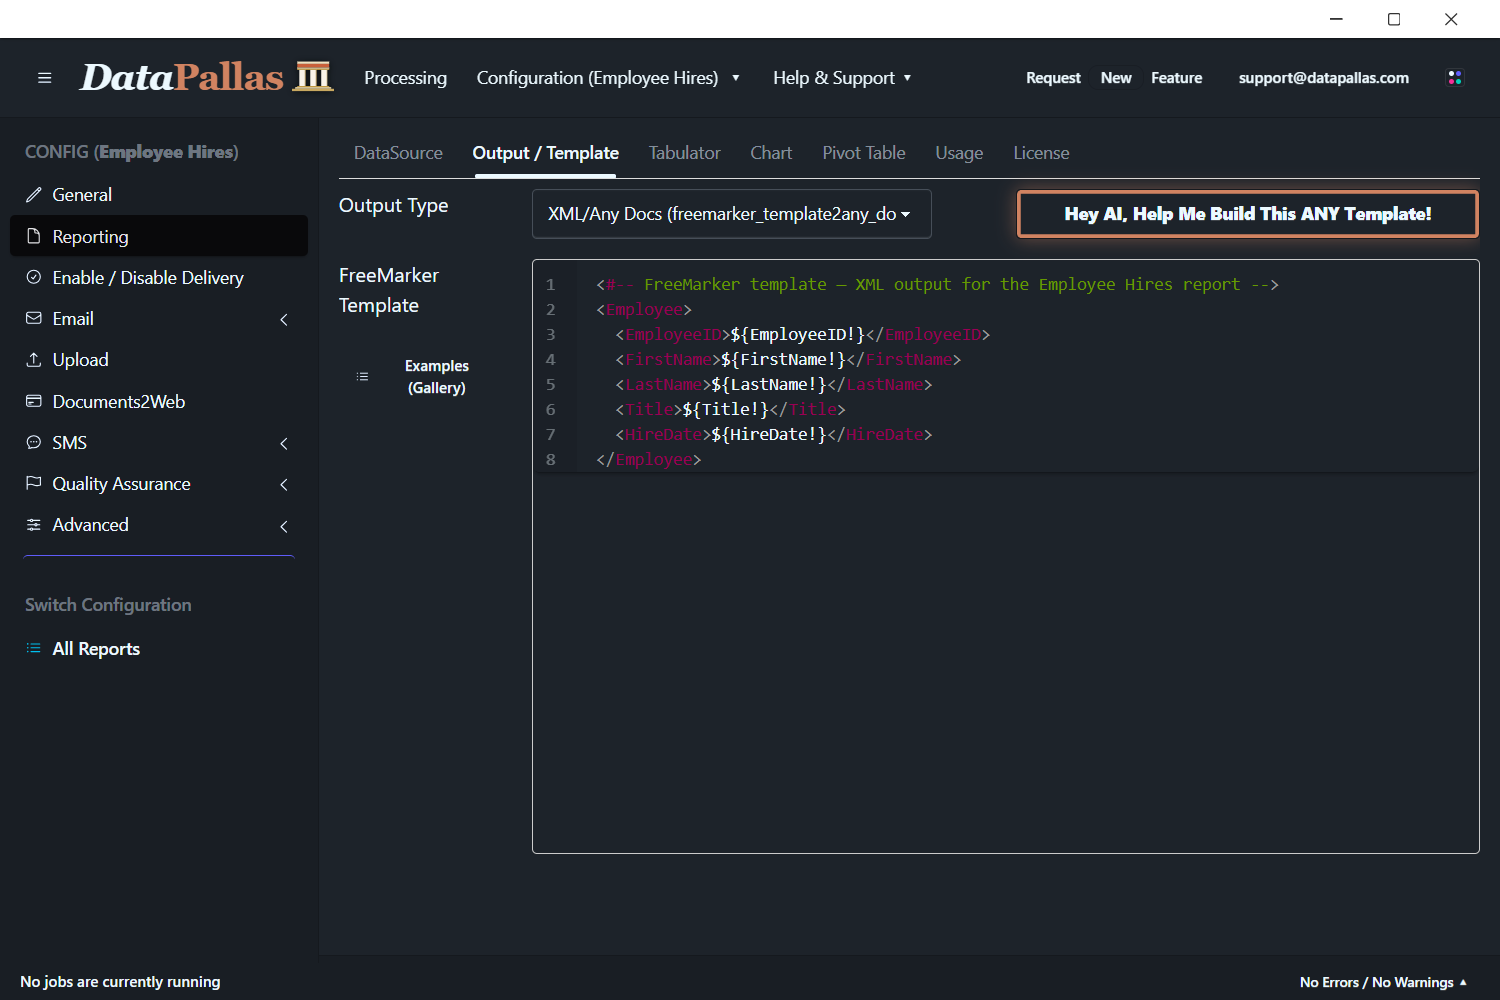
XML, JSON or any other text based format
Generate reports in XML, JSON, or other text formats for integration, automation, or custom needs.
- Features:
- Output structured XML or JSON for easy integration
- Custom templates control format and structure
- Ideal for data exchange, APIs, or importing
- Supports any text-based format, including CSV, TSV, or custom markup
Report Templates Examples Gallery
Templates define how your report data is presented in the final output. For a gallery of example templates and AI prompts — how to modify an existing HTML template or create one from scratch, plus the Microsoft Create business templates gallery and Adobe Color for choosing a theme — see the dedicated page:
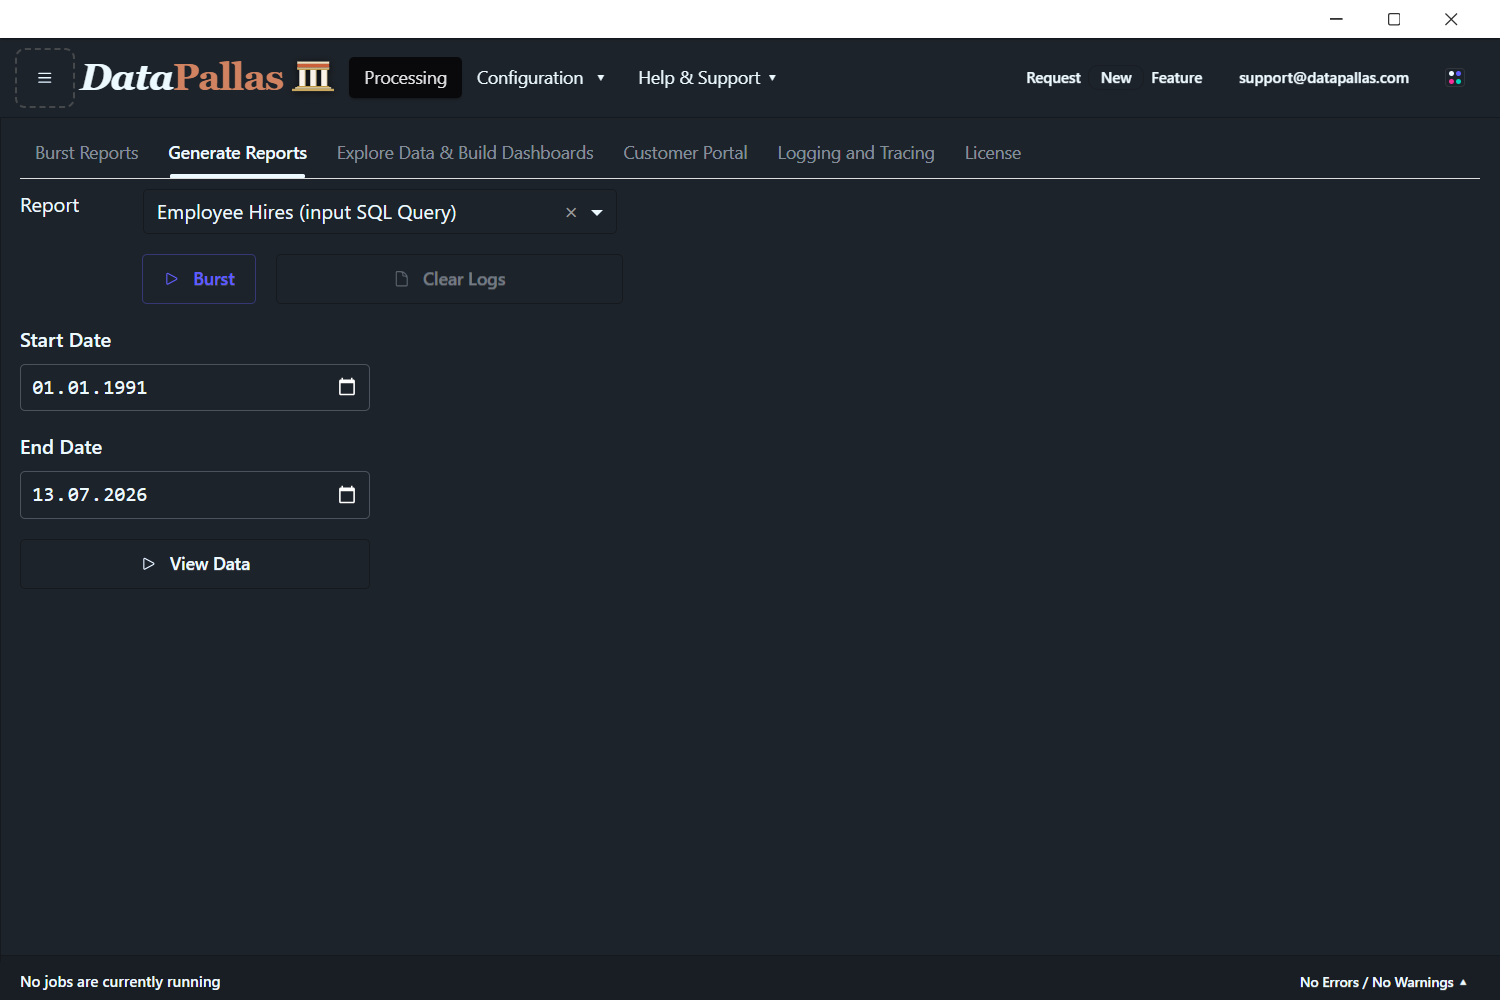
Generate Reports
Once your data source and template are configured, generate reports using DataPallas’s intuitive interface.
Advanced Options & Transformations (for datasources)
DataPallas offers advanced options and transformation features for all supported data sources. These help you fine-tune how your data is loaded, processed, and used in your reports.
Show More Options
Every data source includes a “More Options” panel to customize how your data is read and interpreted. Common options include header configuration, skipping lines, choosing an ID column for bursting, and handling whitespace or special characters.
Each data source type (CSV, Excel, SQL, Script, XML, etc.) also provides specific advanced options—like column definitions for fixed-width files, sheet selection for Excel, or XPath settings for XML.
Explore the “Show More Options” panel for each data source to unlock advanced settings and optimize your report input.
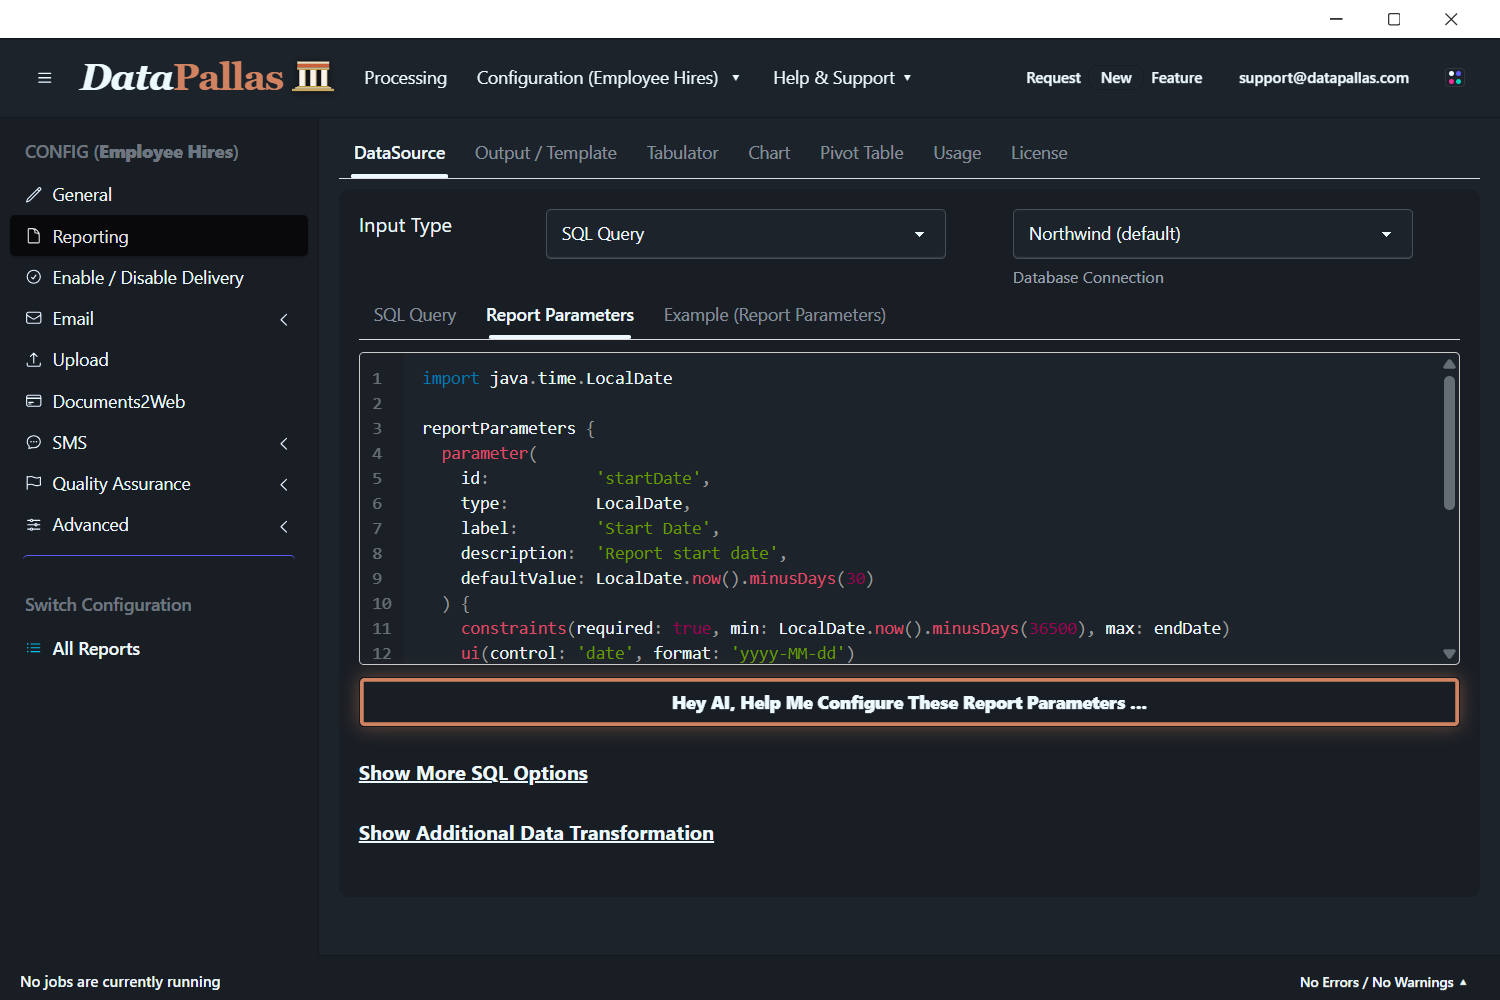
Report Parameters
Report Parameters make your reports interactive and dynamic by prompting users for input at runtime.
For example, create a report that asks for a start and end date, then generates results only for employees hired in that period.
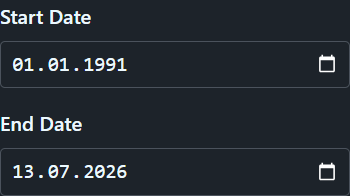
To set up report parameters:
- Define the parameters you need (dates, IDs, categories, etc.).
- Use the example scripts as a starting point, then adjust them for your needs.
- For SQL or script-based reports, combine your parameter definitions with your query or script and use AI to help generate the correct code.
Parameters make it easy to build flexible reports that adapt to user input.
Tip: Copy the example parameter script and your SQL query, then ask your AI assistant to generate the final Groovy DSL code for your report parameters.
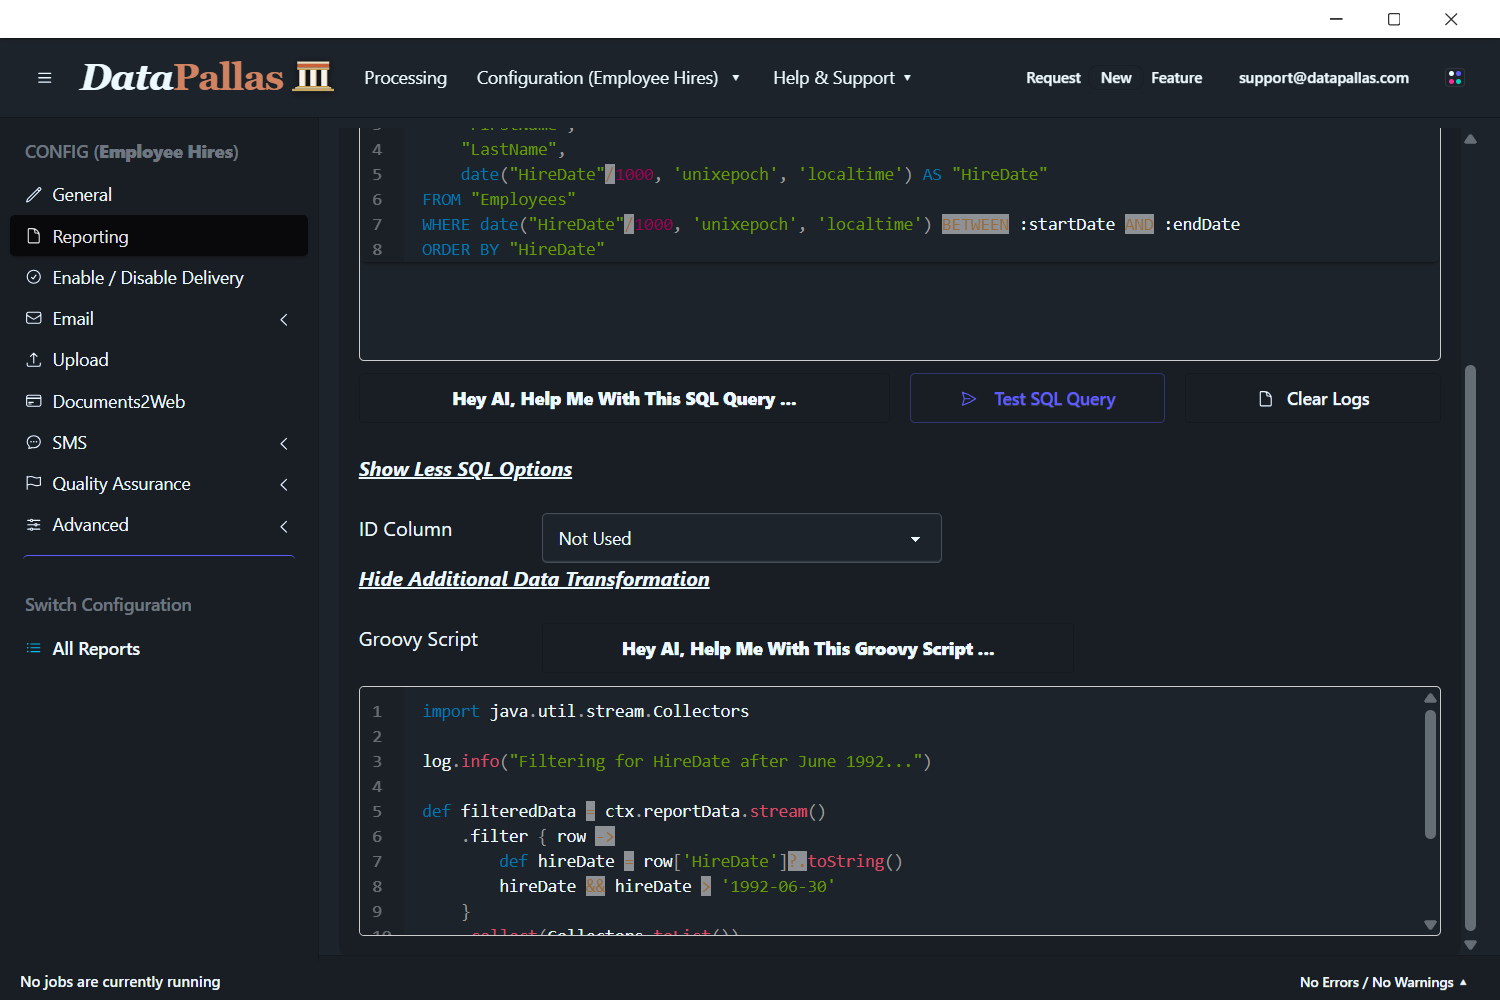
Additional Data Transformation
Additional Data Transformation lets you further process and refine your data after it’s loaded, before it’s used in your report.
Use this feature to filter, group, enrich, or reshape your data—such as removing unwanted rows, calculating new fields, or applying business rules.
Transformation is available for all data sources and is a powerful tool for building advanced, customized reports.
Write transformation scripts (in Groovy) directly in the editor, or use AI to help you generate the code. This is especially useful when your raw data needs extra processing to match your reporting needs.