Semantic Layer (Cubes)
Define metrics, dimensions, and joins once in DataPallas — every report, dashboard, AI query, and embed reads from the same source of truth.
Table of Contents
- Why a Semantic Layer
- What is a Cube in DataPallas
- How It Fits with the Rest of DataPallas
- When to Use It (and When Not To)
- Next Steps
Why a Semantic Layer
Most business questions ("revenue by region last quarter", "active customers by status", "average order value by month") boil down to the same shape: pick a few columns, group by some, aggregate the rest, filter the relevant slice. Writing the SQL for that — every time — requires knowing the schema, remembering the join conditions, getting the GROUP BY right, and not silently double-counting through a one-to-many join.
A semantic layer lifts those decisions out of every query and into one named, reviewed definition. Once a cube exists, anyone — even someone with little or no SQL knowledge — can:
- Pick a cube that matches what they're looking for
- Tick a few dimensions, measures, and filters
- Click Show SQL and copy-paste the generated query into a report, a script, an analysis tool, anywhere
And because every consumer ultimately calls the same generate-sql endpoint behind the scenes, when reports, dashboards, AI chat, and embedded components are wired to read directly from a cube, they will all read from the same metric definition. "Revenue" then means the same thing whether a director clicked it in a chart or a developer pasted the cube's SQL into an integration script.
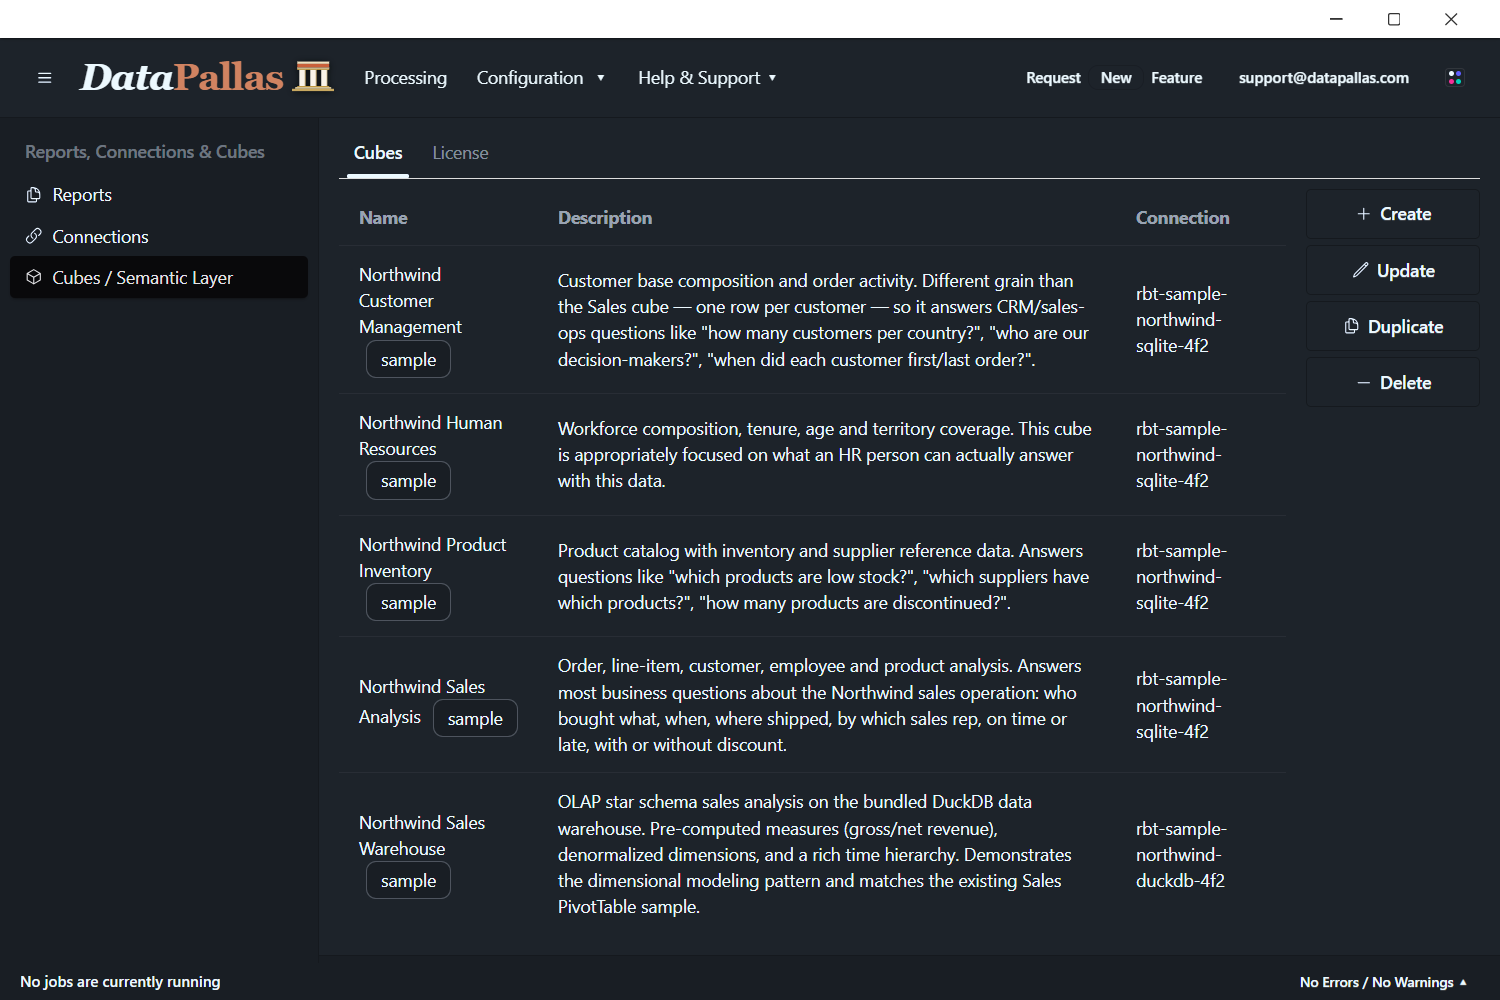
You can show/hide the sample cubes from the top menu: Configuration → More Settings.
The sample cubes shown above (Northwind Customer Management, HR, Inventory, Sales Analysis, Sales Warehouse) ship with DataPallas.
What is a Cube in DataPallas
A Cube sits on top of a database connection and translates the raw schema into business language:
- Dimensions — the columns you slice by, named the way the business talks about them (
Order Status,Ship Country,Order Date— notos_cd,cntry_iso2,dt_ord_utc) - Measures — the aggregations you compute (count, sum of revenue, average order)
- Joins — how the main table connects to related tables (orders → customers), so you never have to remember the foreign keys
- Segments — reusable named filters ("last 30 days", "active customers", "completed orders")
- Hierarchies — drill-down paths (country → region → city)
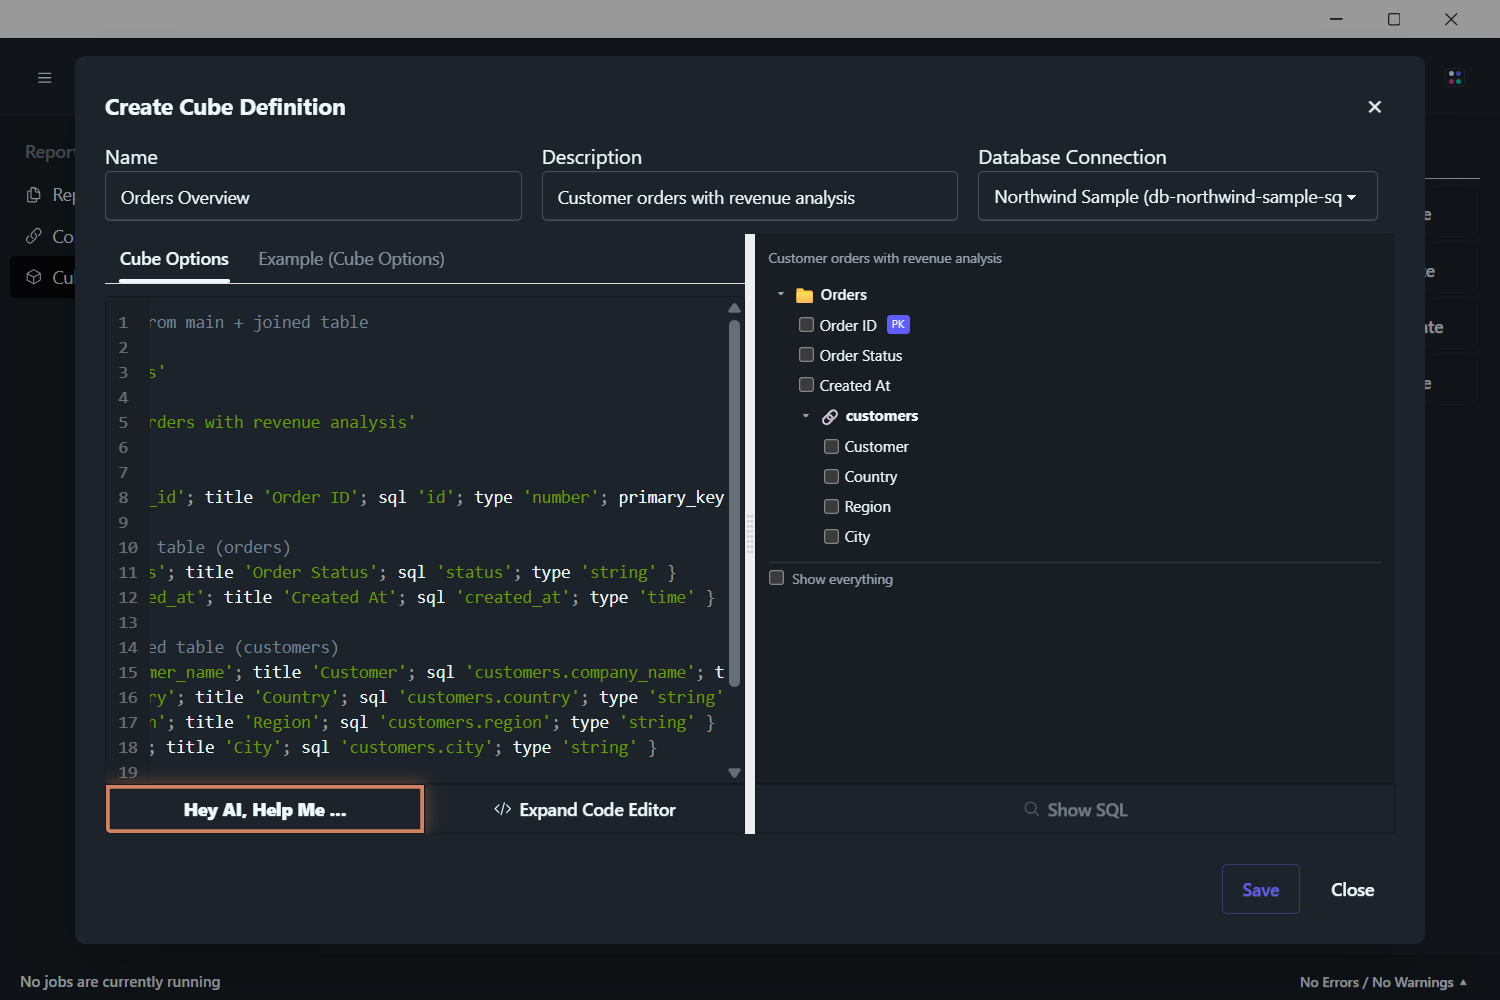
A cube is, in effect, a business-meaningful map of your data. Open a cube and you see a clean list of things you can ask about — no scrolling through 200 cryptic table names, no guessing which join condition is correct. Tick a few fields, get a result. If you need the SQL itself, click Show SQL.
You don't need to write a cube from scratch — DataPallas ships with sample cubes you can start from, and a built-in Hey AI, Help Me… button drafts a cube for you in plain English against your live schema.
How It Fits with the Rest of DataPallas
A cube is a thin layer that sits between your raw database and everything you build on top of it:
- Below the cube — the database connection, which still owns the credentials and the live schema
- Inside the cube — your named business metrics: dimensions, measures, joins, segments, hierarchies
- Above the cube — the consumers that ask the cube for data: the Explore Data Canvas (drop a cube, get an interactive widget), generated SQL you copy into reports, charts and dashboards, AI chat, and embedded components
Cubes do not replace any of those — they fit between them. A connection still owns credentials; a report still owns formatting and distribution. The cube owns what the metrics mean, and turns those meanings into SQL on demand for everything downstream.
When to Use It (and When Not To)
Use a cube when:
- You're writing a new report and need SQL fast. Open a cube, tick the fields you need, click Show SQL, paste it into the report. No remembering join syntax, no
LEFT JOIN customers ON …, noGROUP BYtypos. This is the everyday use case — even seasoned developers reach for it because it's faster than typing the SQL by hand. - You only know your business, not your schema. Tables called
t_ord_hdr_v2andcust_dim_currmean nothing to most people. A cube renames them into the language the business uses ("Orders", "Customers") so anyone can navigate the data without a schema cheat-sheet. - You want to discover what data is available. Browsing cubes is a much friendlier on-ramp than scrolling through hundreds of tables. Cubes only expose what's been deemed business-meaningful.
- The same metric is consumed in multiple places (a report, a dashboard, an AI question) and you want everyone to see the same number.
- Non-technical users are about to start asking questions through AI chat or interactive cube widgets embedded in your apps.
Skip the cube when:
- You already have the exact SQL you need and you're confident in it
- The query is a one-off ad-hoc lookup nobody else will ever run
- The data source is already shaped exactly the way you want (no joins, no aggregations, no renames)
Next Steps
- Your First Cube — build a working cube on the Northwind sample in five minutes
- DSL Reference — every keyword, attribute, and example