Your First Cube
Build a working semantic-layer cube on the bundled Northwind sample database in five minutes.
Table of Contents
- Before You Start
- Step 1 — Open the Cubes Area
- Step 2 — Create a New Cube
- Step 3 — Define Dimensions and Measures
- Step 4 — Preview, Pick Fields, Inspect SQL
- Step 5 — Save and Reuse
- What's Next
Before You Start
You need:
- DataPallas running locally
- Any database connection — the bundled Northwind (DuckDB) sample is perfect for this walkthrough; no setup needed
If you've never created a database connection before, follow DB Connections first.
Step 1 — Open the Cubes Area
From the top menu, open Reports, Connections & Cubes, then click Cubes / Semantic Layer in the left sidebar.
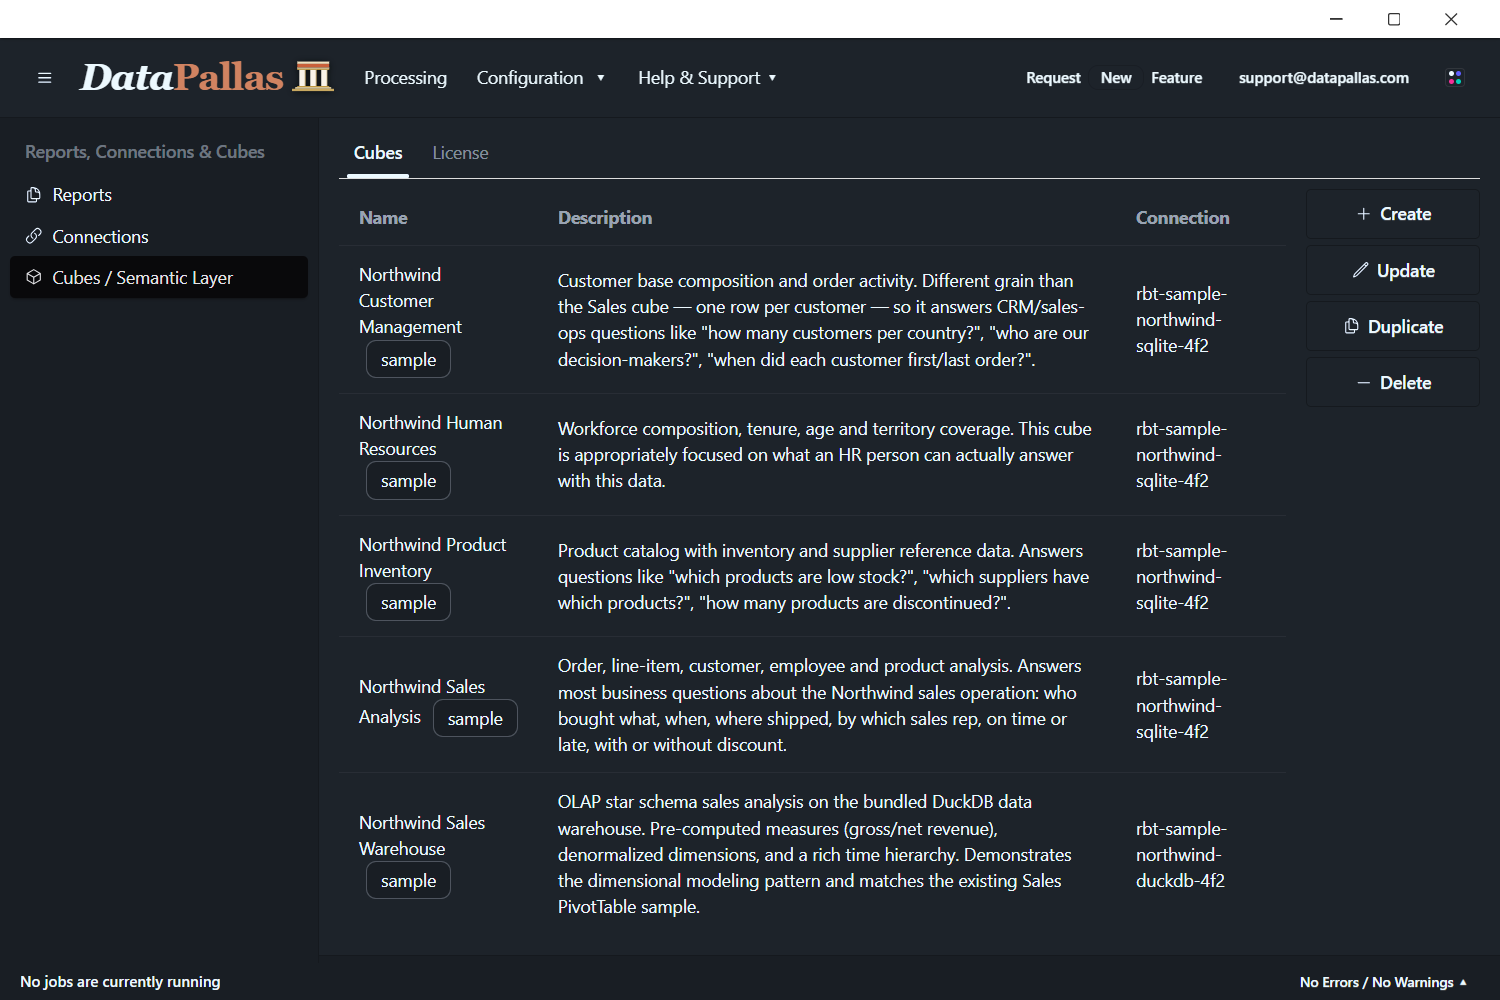
You can show/hide the sample cubes from the top menu: Configuration → More Settings.
The five Northwind cubes you see above (Customer Management, HR, Inventory, Sales Analysis, Sales Warehouse) are samples bundled with DataPallas.
If this is a fresh install you'll see an empty list with a New button on the right.
Step 2 — Create a New Cube
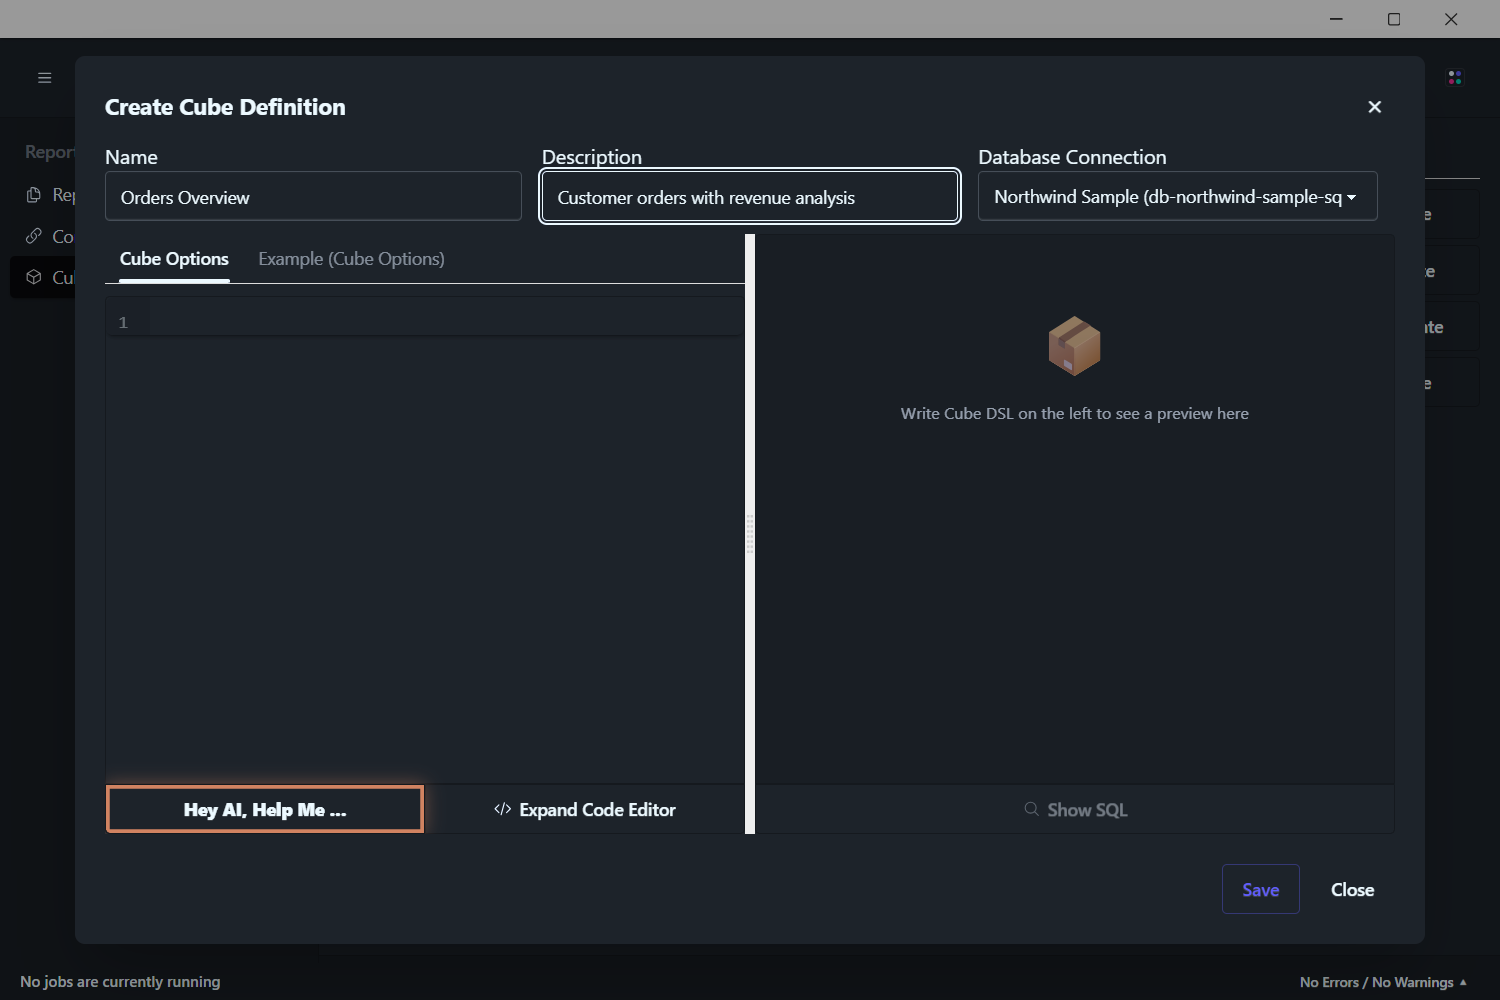
Click New and fill the three top fields:
- Name —
orders_overview(used internally; lowercase + underscores recommended) - Description —
Customer orders with revenue analysis - Database Connection — pick the Northwind DuckDB sample (or your own connection)
Step 3 — Define Dimensions and Measures
You have three easy paths to fill the cube definition — pick whichever suits you:
- Click "Hey AI, Help Me…" — describe in plain English what cube you want, and the AI drafts it for you against your live schema. Most users start here.
- Open the "Example (Cube Options)" tab — a fully-annotated example you can copy and adapt.
- Paste a starter like the one below directly into the editor:
cube {
  sql_table 'orders'
  title 'Orders'
  description 'Customer orders with revenue analysis'

  // Primary key
  dimension { name 'order_id'; title 'Order ID'; sql 'OrderID'; type 'number'; primary_key true }

  // Slicing dimensions
  dimension { name 'order_date'; title 'Order Date'; sql 'OrderDate'; type 'time' }
  dimension { name 'ship_country'; title 'Ship Country'; sql 'ShipCountry'; type 'string' }
  dimension { name 'ship_city'; title 'Ship City'; sql 'ShipCity'; type 'string' }

  // Measures
  measure { name 'order_count'; title 'Order Count'; type 'count' }
  measure { name 'avg_freight'; title 'Average Freight'; sql 'Freight'; type 'avg'; format 'currency' }
  measure { name 'total_freight'; title 'Total Freight'; sql 'Freight'; type 'sum'; format 'currency' }
}Don't worry about the syntax — it's just a list of dimension and measure blocks with descriptive names. If you ever need to tweak something specific later, the full keyword reference lives in the DSL Reference.
Step 4 — Preview, Pick Fields, Inspect SQL
When the cube parses successfully, the right-hand pane shows a live preview against your real database — a tree of all the dimensions, measures, and filters you defined. Tick a few of them; the cube uses your selection to fetch data inline.
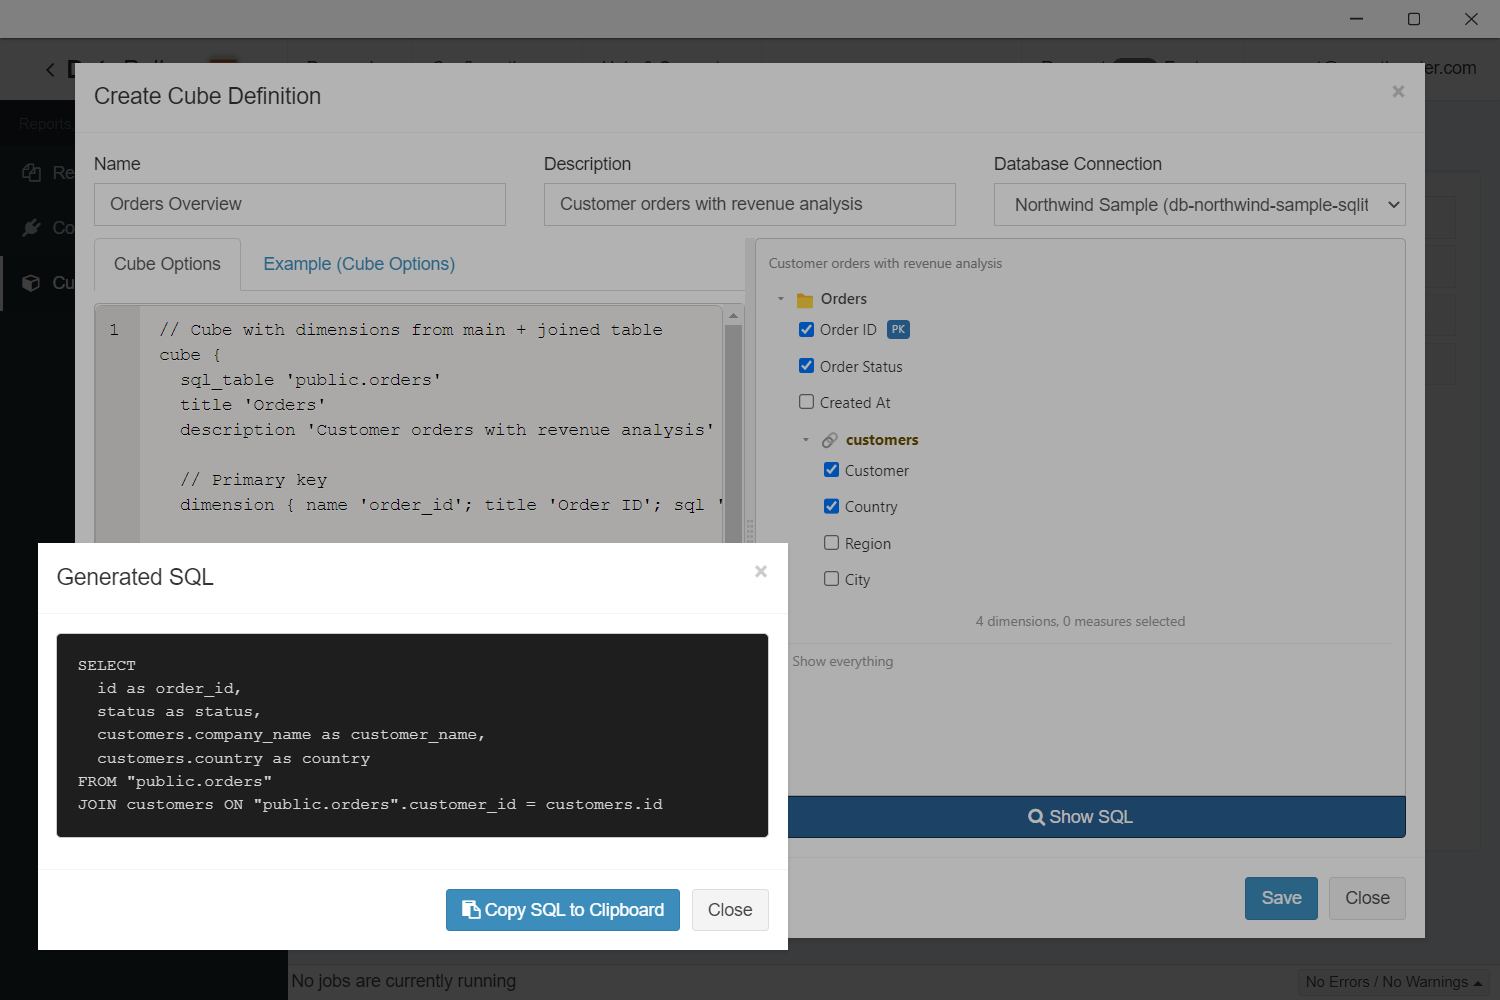
Click Show SQL at the bottom to see exactly what query the cube generated for your selection — useful for debugging and for handing the SQL to your DBA when needed.
If you see a red error message, fix the cube definition on the left and the preview re-validates as you type. If you're stuck, hit Hey AI, Help Me… and tell the AI what's wrong.
Step 5 — Save and Reuse
Click Save. Your cube is now a permanent fixture you can come back to.
The most common everyday workflow: when you need to write a new report or quickly answer a question, open the cube, tick the fields you want, click Show SQL, and paste the generated query into wherever you need it (a report's data source, a SQL editor, a script). The cube did the SQL writing for you — no remembering joins, no looking up column names, no GROUP BY mistakes.
Beyond that, the cube also feeds:
- Reports — pick the cube as a data source instead of writing SQL by hand
- Dashboards — drop charts, pivots, and tables that all read from the same definition
- AI chat & data exploration — Athena and the
/explore-datacanvas use cubes as their grammar for natural-language questions and interactive widgets
What's Next
- The full DSL Reference — joins, segments, hierarchies, formatting, types